ATD Blog
Displaying Text With Visuals: What Are the Best Practices?
Wed Mar 06 2013

Attend the Evidence-Based Learning Virtual Conference, and learn more best practices like these from 6 of learning’s top thought leaders.
Content
Whether you prepare slides, e-learning screens, print-based materials, or all three, chances are, you frequently need to describe a visual with text. You may need to list the steps to use equipment or online applications. Or you may need to describe how something works. What’s the best way to organize and display text in conjunction with a visual to promote learning? Take a look at the two experimental treatments in the figures to follow and answer the following questions:
Whether you prepare slides, e-learning screens, print-based materials, or all three, chances are, you frequently need to describe a visual with text. You may need to list the steps to use equipment or online applications. Or you may need to describe how something works. What’s the best way to organize and display text in conjunction with a visual to promote learning? Take a look at the two experimental treatments in the figures to follow and answer the following questions:
Content
1. Which do you think led to better learning?
1. Which do you think led to better learning?
Content
2. What are the major differences between the two displays?
2. What are the major differences between the two displays?
Content
Content
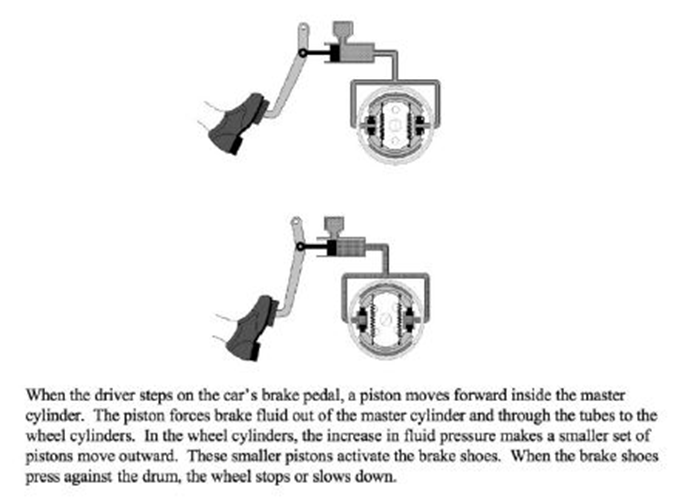
Figure 1. How Brakes Work: Version 1 (Johnson and Mayer, 2012)
Figure 1. How Brakes Work: Version 1 (Johnson and Mayer, 2012)
Content
Content
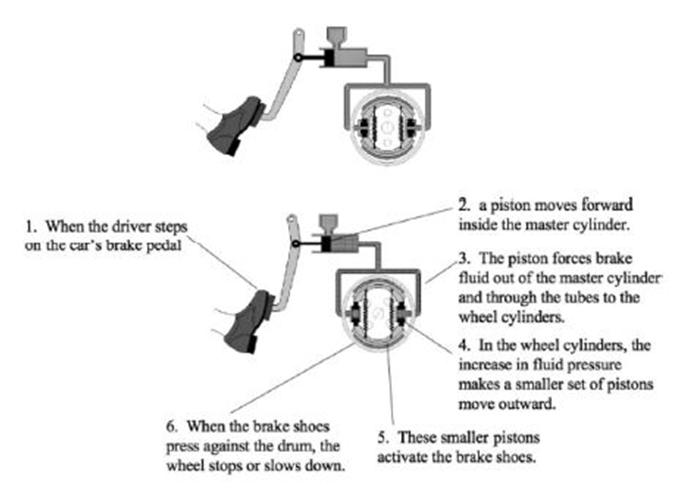
Figure 2. How Brakes Work: Version 2 (Johnson and Mayer, 2012)
Figure 2. How Brakes Work: Version 2 (Johnson and Mayer, 2012)
Content
How to Best Display Text With Graphics
How to Best Display Text With Graphics
Content
In the experiment, 44 university students were randomly assigned to study how brakes work from one of the two the versions shown in Figures 1 and 2. As the students reviewed the display, their eye movements and eye fixations were tracked. After a short study period, they were tested with problems such as, “What could be done to make brakes more reliable – that is, to make sure they would not fail?” The learners studying Figure 2 averaged significantly higher scores on the test than those studying Figure 1, with a high effect size of 0.80.
In the experiment, 44 university students were randomly assigned to study how brakes work from one of the two the versions shown in Figures 1 and 2. As the students reviewed the display, their eye movements and eye fixations were tracked. After a short study period, they were tested with problems such as, “What could be done to make brakes more reliable – that is, to make sure they would not fail?” The learners studying Figure 2 averaged significantly higher scores on the test than those studying Figure 1, with a high effect size of 0.80.
Content
What features made Figure 2 more effective? One obvious difference is the alignment of the text close to the relevant portion of the visual rather than all displayed at the bottom of the slide as in Figure 1. The alignment of text close to the relevant portion of a visual is called the spatial contiguity effect and has been shown to lead to better learning, with a mean effect size of 0.72 (Ginns, 2006). Note that Version 2 also includes numbers as well as a line to link text and visual elements. Another benefit of text alignment is segmenting the text into short phrases. Rather than five sentences displayed at the bottom of the screen in Figure 1, the integrated version displays the content in six short phrases.
What features made Figure 2 more effective? One obvious difference is the alignment of the text close to the relevant portion of the visual rather than all displayed at the bottom of the slide as in Figure 1. The alignment of text close to the relevant portion of a visual is called the spatial contiguity effect and has been shown to lead to better learning, with a mean effect size of 0.72 (Ginns, 2006). Note that Version 2 also includes numbers as well as a line to link text and visual elements. Another benefit of text alignment is segmenting the text into short phrases. Rather than five sentences displayed at the bottom of the screen in Figure 1, the integrated version displays the content in six short phrases.
Content
Why Is Integrated Text More Effective?
Why Is Integrated Text More Effective?
Content
An analysis of student eye movements showed that both groups spent more time reviewing the text than the diagrams and used the text to guide their processing of the graphics. However those studying the integrated version made more integrative and corresponding eye transitions between text and visual than those using the separated version. In other words, those viewing the integrated version looked at the corresponding part of the diagram after reading a segment of text more often than individuals viewing the separated version. The more frequent visual integration of text and relevant portion of the diagram promoted better cognitive integration of text and visual and led to deeper understanding.
An analysis of student eye movements showed that both groups spent more time reviewing the text than the diagrams and used the text to guide their processing of the graphics. However those studying the integrated version made more integrative and corresponding eye transitions between text and visual than those using the separated version. In other words, those viewing the integrated version looked at the corresponding part of the diagram after reading a segment of text more often than individuals viewing the separated version. The more frequent visual integration of text and relevant portion of the diagram promoted better cognitive integration of text and visual and led to deeper understanding.
Content
In summary, we have a solid foundation of evidence calling for segmenting text into short phrases and integrating it close to the relevant portion of the visual. Placement of text near a visual helps the learner integrate the corresponding content in their mind to form a better mental model.
In summary, we have a solid foundation of evidence calling for segmenting text into short phrases and integrating it close to the relevant portion of the visual. Placement of text near a visual helps the learner integrate the corresponding content in their mind to form a better mental model.
Content
Your Lessons Learned: RSVP
Your Lessons Learned: RSVP
Content
How do you place explanatory text with a related visual? Have you tried a layout such as that shown in Figure 2? What outcomes did you notice? Did you need more or different resources (time, tools, etc) to prepare an integrated version? Please comment with your lessons learned.
How do you place explanatory text with a related visual? Have you tried a layout such as that shown in Figure 2? What outcomes did you notice? Did you need more or different resources (time, tools, etc) to prepare an integrated version? Please comment with your lessons learned.
Content
References
References
Content
Ginns, P. (2006). Integrating information: A meta-analysis of the spatial contiguity and temporal contiguity effects. Learning and Instruction, 16, 511-525.
Ginns, P. (2006). Integrating information: A meta-analysis of the spatial contiguity and temporal contiguity effects. Learning and Instruction, 16, 511-525.
Content
Johnson, C.I. & Mayer, R.E. (2012). An eye movement analysis of the spatial contiguity effect in multimedia learning. Journal of Experimental Psychology: Applied, 18, 178-191.
Johnson, C.I. & Mayer, R.E. (2012). An eye movement analysis of the spatial contiguity effect in multimedia learning. Journal of Experimental Psychology: Applied, 18, 178-191.