ATD Blog
5 Steps to a Graphic Development Work Flow for E-Learning
Thu Sep 01 2016

Content
Content
When designing e-learning courseware, you probably use plenty of images. Perhaps the images exist in different states of readiness and perhaps you organize them in different ways for each project. In some projects, you may not know what graphics you need until the last minute and in others you could be working from a detailed storyboard that specifies everything.
When designing e-learning courseware, you probably use plenty of images. Perhaps the images exist in different states of readiness and perhaps you organize them in different ways for each project. In some projects, you may not know what graphics you need until the last minute and in others you could be working from a detailed storyboard that specifies everything.
Content
Whatever the case may be, adopting a strict approach to graphic organization and work flow will improve your speed and efficiency. Work runs more smoothly when you do repetitive tasks in batches—and when you can quickly find the graphics you need a month or a year later. The more organized you are, the more cognitive resources you will have for being your brilliant self.
Whatever the case may be, adopting a strict approach to graphic organization and work flow will improve your speed and efficiency. Work runs more smoothly when you do repetitive tasks in batches—and when you can quickly find the graphics you need a month or a year later. The more organized you are, the more cognitive resources you will have for being your brilliant self.
Content
With all of these benefits, I thought I’d share my work flow and organizational strategy for working with images that you may want to use or modify for your needs. If you are interested in work flow, you may also want to read about a production work flow for developing e-learning.
With all of these benefits, I thought I’d share my work flow and organizational strategy for working with images that you may want to use or modify for your needs. If you are interested in work flow, you may also want to read about a production work flow for developing e-learning.
1. Review Graphic Needs
Content
Like most of you, I like to get a full overview of a project before getting too deep into graphic development. That way there are no surprises half-way through. I find that asking these types of questions is quite helpful:
Like most of you, I like to get a full overview of a project before getting too deep into graphic development. That way there are no surprises half-way through. I find that asking these types of questions is quite helpful:
Content
What are the visual needs for this course?
What are the visual needs for this course?
Content
What visuals will enhance and promote learning?
What visuals will enhance and promote learning?
Content
Have I worked on similar projects from which I can get ideas?
Have I worked on similar projects from which I can get ideas?
Content
The answer might be that you need illustrated diagrams or a custom photo shoot. You might just need some motivational photographs that add to the project aesthetically.
The answer might be that you need illustrated diagrams or a custom photo shoot. You might just need some motivational photographs that add to the project aesthetically.
2. Work on the Style
Content
When I know the graphic requirements, I start to determine the visual style that would be appropriate. Although the visual style may evolve over time, I try out different approaches in a prototype to see what can work for the particular content and audience.
When I know the graphic requirements, I start to determine the visual style that would be appropriate. Although the visual style may evolve over time, I try out different approaches in a prototype to see what can work for the particular content and audience.
Content
I know from creativity research—and personal experience—that a solution doesn’t usually come in a flash of insight. It’s more likely to come from playful experimentation, inspirational resources, and by giving ideas time to simmer. When I have a general idea of the style, I know what type of backgrounds and graphics that I’ll be using. For example, it might be photographs or simple iconic illustrations.
I know from creativity research—and personal experience—that a solution doesn’t usually come in a flash of insight. It’s more likely to come from playful experimentation, inspirational resources, and by giving ideas time to simmer. When I have a general idea of the style, I know what type of backgrounds and graphics that I’ll be using. For example, it might be photographs or simple iconic illustrations.
3. Set Up Graphic Folders
Content
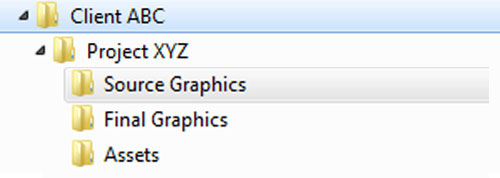
The way that I organize graphics for each project reflects my work flow. I create a folder for each client and project and within that project folder are three folders for graphics: source graphics, final graphics and assets. Here is what I file in each of the folders:
The way that I organize graphics for each project reflects my work flow. I create a folder for each client and project and within that project folder are three folders for graphics: source graphics, final graphics and assets. Here is what I file in each of the folders:
Content
Source Graphics: Original photos and images that will be modified for final use, as well as Photoshop and Illustrator files. (The type of graphic editor you use doesn’t matter.) Some designers differentiate by the tool, creating one folder for each graphic tool they use. I haven’t found that to be necessary.
Source Graphics: Original photos and images that will be modified for final use, as well as Photoshop and Illustrator files. (The type of graphic editor you use doesn’t matter.) Some designers differentiate by the tool, creating one folder for each graphic tool they use. I haven’t found that to be necessary.
Content
Final Graphics: These are the final version of each graphic that will be inserted into an authoring tool or website.
Final Graphics: These are the final version of each graphic that will be inserted into an authoring tool or website.
Content
Assets: These are the client assets, such as marketing photos, logos, color palettes, and so forth.
Assets: These are the client assets, such as marketing photos, logos, color palettes, and so forth.
Content
The reason for the differentiation between source graphics and final graphics is that every image you get in its original format can be modified to better suit your needs. Some of the most common modifications you can make to your source graphics are:
The reason for the differentiation between source graphics and final graphics is that every image you get in its original format can be modified to better suit your needs. Some of the most common modifications you can make to your source graphics are:
Content
Cropping an image to focus on the most important person or event and to remove extraneous visual information.
Cropping an image to focus on the most important person or event and to remove extraneous visual information.
Content
Adjusting brightness and contrast to improve visual clarity
Adjusting brightness and contrast to improve visual clarity
Content
Reducing the dimensions to reduce the size of the file
Reducing the dimensions to reduce the size of the file
Content
Reducing the resolution to reduce the size of the file; many stock photos are 300 dpi (dots per inch), which has the detail you need for print, but not for web display. If you reduce the image to somewhere between 72 to 125 dpi or ppi (pixels per inch), you will reduce the file size. This can improve the performance of a running course or of a website.
Reducing the resolution to reduce the size of the file; many stock photos are 300 dpi (dots per inch), which has the detail you need for print, but not for web display. If you reduce the image to somewhere between 72 to 125 dpi or ppi (pixels per inch), you will reduce the file size. This can improve the performance of a running course or of a website.
Content
Fortunately, there are many tools online and offline that allow you to make these adjustments.
Fortunately, there are many tools online and offline that allow you to make these adjustments.
4. Organize Source Graphics and Finals
Content
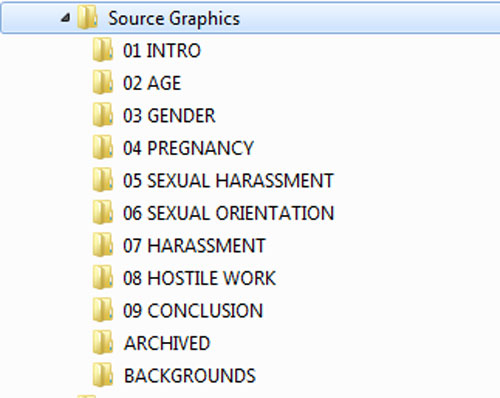
I typically organize both the source graphics folder and the final graphics folder by topic. As sure as death and taxes, you can count on needing to find an obscure graphic again because of a revision. For a recent project on discrimination and harassment in the workplace, I arranged my source graphics folder by topic. Adding numbers for the order of topics is optional. I thought I’d try it out.
I typically organize both the source graphics folder and the final graphics folder by topic. As sure as death and taxes, you can count on needing to find an obscure graphic again because of a revision. For a recent project on discrimination and harassment in the workplace, I arranged my source graphics folder by topic. Adding numbers for the order of topics is optional. I thought I’d try it out.
Content
I don’t need to show you this, but the final graphics folder looks exactly the same. The final graphics are the ones inserted into the course. They will look different than the originals and they will typically be a smaller file size.
I don’t need to show you this, but the final graphics folder looks exactly the same. The final graphics are the ones inserted into the course. They will look different than the originals and they will typically be a smaller file size.
5. Get or Create Visuals
Content
Now I’m ready to seriously gather the visuals. How I work depends on where I find the graphics.
Now I’m ready to seriously gather the visuals. How I work depends on where I find the graphics.
Content
Stock Photo Downloads. Searching through images can take a long time because it’s often difficult to find the appropriate ones, so it saves time to do this task in batches. That is, it’s more efficient to search through a stock photo site for multiple images than to search for one at a time as you go along. The search results may show related images where you can spot one you’ll need later in the course. This is akin to catching two fish on one hook. So before I start my search, I identify a batch of images that I will need.
Stock Photo Downloads. Searching through images can take a long time because it’s often difficult to find the appropriate ones, so it saves time to do this task in batches. That is, it’s more efficient to search through a stock photo site for multiple images than to search for one at a time as you go along. The search results may show related images where you can spot one you’ll need later in the course. This is akin to catching two fish on one hook. So before I start my search, I identify a batch of images that I will need.
Content
Photo Shoot or Illustrations. Sometimes I conduct a custom photo shoot—that means it was planned ahead with a shot list. In this case, it’s easy to download all of the photos at one time from the photographer’s site. An illustrator, on the other hand, may provide you with images over a period of time as they are completed.
Photo Shoot or Illustrations. Sometimes I conduct a custom photo shoot—that means it was planned ahead with a shot list. In this case, it’s easy to download all of the photos at one time from the photographer’s site. An illustrator, on the other hand, may provide you with images over a period of time as they are completed.
Content
Original Graphics. If I need to create graphics from scratch, such as in Illustrator or PowerPoint, then I find it’s best to do this in batches too. The point is that every time you switch a task, there is some cognitive overhead associated with it.
Original Graphics. If I need to create graphics from scratch, such as in Illustrator or PowerPoint, then I find it’s best to do this in batches too. The point is that every time you switch a task, there is some cognitive overhead associated with it.
Content
Want to learn more? Check out my book Visual Design Solutions . I’m also talking about visual design at ATD’s Core 4 Conference . Our inaugural event has reached capacity, but we are planning a second event for 2017. Please sign up for updates to be notified of details.
Want to learn more? Check out my book Visual Design Solutions. I’m also talking about visual design at ATD’s Core 4 Conference. Our inaugural event has reached capacity, but we are planning a second event for 2017. Please sign up for updates to be notified of details.