ATD Blog
Estimating the Potential Impact of Star Performers
Thu Oct 03 2013

What would be the impact on your company if you closed the gap between average performers and star performers by 20 percent, 30 percent, or even 40 percent?
Here are some ideas on how you can drive greater business results by leveraging exemplary performers throughout your organization. Simply put, by shifting the performance curve, you automatically:
drive results
enhance revenue and
improve margins.
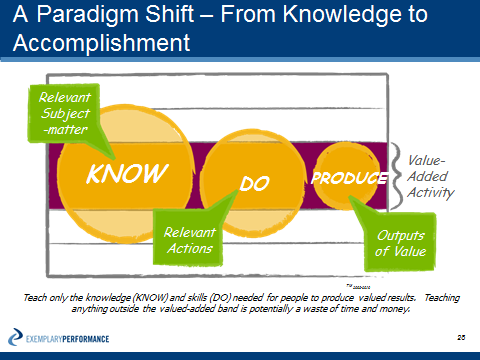
This paradigm shift from looking at knowledge to accomplishments enables organizations, their leaders, and associated work teams, to capture more value with
existing resources. More important, in a “do more with less” economy, this approach can clearly differentiate you from your competition.
Focusing on accomplishments or results is essential. As the figure below indicates, a lot of what an individual worker knows and a lot of what they do fall outside of the band of value-added knowledge and activity. (You must analyze from right to left—from outputs to actions to knowledge—to ensure you are focusing your performance improvement resources on what really matters.)

A simple example
Imagine you are responsible for a customer contact center with a team of 200 customer service representatives (CSRs). The goal for each team member is to upsell each inbound phone call by 15 percent, and the average order size is $40.
Currently, the contact center handles 12,000 inbound phone calls. The average upsell is 8 percent, which is far below the goal. In contrast, your 12 best performers have an average upsell up 22 percent.
One major accomplishment for each CSR, therefore, is $6 in enhanced revenue per call. The actual additional revenue per call is $3.20. Meanwhile, the exemplary performers are producing an additional $8.80 per call handled.
Significant potential value to the company exists in this scenario by leveraging the expertise of those 12 stars and improving the performance of the other 188 CSRs. By doing so, they achieve an additional $2.80 per call, times the 11,280 calls handled by these average CSRs. This equates to $31,584 per day in enhanced revenue with zero additional costs to the contact center.
So at a high level, this is the process we’ve been discussing for estimating the potential value of your performance improvement opportunities:
Compile a list of those roles within your organization that they align closely with your strategic intent and exhibit a high degree of variability in performance across role incumbents.
Identify one or more major accomplishments for each critical role on your list. By the way, this can be a more challenging activity than what you may expect.
Review the best available data on the current variance in performance.
Estimate the percentage by which you can reduce that variance.
Calculate the value of shifting the performance curve to the right by the estimated amount.
Now, take a look at the notes you made the other day. Align that with the list above, and then we’ll be ready to look at the steps needed to clearly identify your exemplary performers within targeted roles—both individuals and teams.
For more on how to shift the performance curve, check out Paul’s previous blog article in this series.
