ATD Blog
Evidence-Based Survey Design: The Use of Sliders
Thu Oct 24 2019

Content
Put yourself in this scenario: Next week, you will deliver a workshop to a group of professionals. After the workshop, you want to send a feedback survey to the participants, which they can complete online. You are currently developing that survey with questions such as:
Put yourself in this scenario: Next week, you will deliver a workshop to a group of professionals. After the workshop, you want to send a feedback survey to the participants, which they can complete online. You are currently developing that survey with questions such as:
Content
How relevant was the content of the workshop to your job role?
How relevant was the content of the workshop to your job role?
Content
How effective was the practice session in helping you learn the content?
How effective was the practice session in helping you learn the content?
Content
How likely are you to use the skills you learned from this workshop without assistance?
How likely are you to use the skills you learned from this workshop without assistance?
Content
How likely are you to recommend this workshop to your co-workers?
How likely are you to recommend this workshop to your co-workers?
Content
These survey questions should be closed-ended questions , and your online survey software offers several design options for rating scales .
These survey questions should be closed-ended questions, and your online survey software offers several design options for rating scales.
Content
For the type of response options, you may choose:
For the type of response options, you may choose:
Content
verbal descriptor scales
verbal descriptor scales
Content
numerical rating scales.
numerical rating scales.
Content
For the level of data precision, you may choose:
For the level of data precision, you may choose:
Content
discrete rating scales
discrete rating scales
Content
continuous rating scales.
continuous rating scales.
Content
With these design options in mind, let’s say you narrowed your choices to three different rating scales (A through C below).
With these design options in mind, let’s say you narrowed your choices to three different rating scales (A through C below).
Content
A. Four-Point Verbal Descriptor Scale
A. Four-Point Verbal Descriptor Scale
Content
Not at all
Not at all
Content
A little bit
A little bit
Content
Quite a bit
Quite a bit
Content
Definitely
Definitely
Content
B. 11-Point Numerical Rating Scale
B. 11-Point Numerical Rating Scale
Content
Not at all - 1 - 2 - 3 - 4 - 5 - 6 - 7 -8 - 9 - 10 - Definitely
Not at all - 1 - 2 - 3 - 4 - 5 - 6 - 7 -8 - 9 - 10 - Definitely
Content
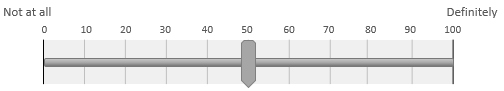
C. Slider With a Range From Zero to 100 (measuring data up to the hundredth place after the decimal point; for example, 32.93 or 65.28)
C. Slider With a Range From Zero to 100 (measuring data up to the hundredth place after the decimal point; for example, 32.93 or 65.28)
Content
The first two scales (A and B) are discrete rating scales. They provide a discrete number of options from which to choose. The number of options in typical discrete rating scales may vary from two to 11. The third one (C) is a continuous rating scale. The slider shown allows for a much more granular level of data to be recorded.
The first two scales (A and B) are discrete rating scales. They provide a discrete number of options from which to choose. The number of options in typical discrete rating scales may vary from two to 11. The third one (C) is a continuous rating scale. The slider shown allows for a much more granular level of data to be recorded.
Content
Now, you’re not sure which rating scale you should use and why. Your co-worker is recommending you use the slider because it is a new technology and makes your survey look cool. Is the “coolness factor” really going to inspire more engagement? How can you find trustworthy advice about the pros and cons of using sliders?
Now, you’re not sure which rating scale you should use and why. Your co-worker is recommending you use the slider because it is a new technology and makes your survey look cool. Is the “coolness factor” really going to inspire more engagement? How can you find trustworthy advice about the pros and cons of using sliders?
Content
We took a deep dive into this question, reviewing dozens of studies. We discovered that some researchers reported a few benefits when using continuous rating scales.
We took a deep dive into this question, reviewing dozens of studies. We discovered that some researchers reported a few benefits when using continuous rating scales.
Content
The data obtained from continuous rating scales may show higher inter-rater reliability compared with using a discrete rating scale with a limited number of options to choose from ( Wall et al. 2017 ).
The data obtained from continuous rating scales may show higher inter-rater reliability compared with using a discrete rating scale with a limited number of options to choose from (Wall et al. 2017).
Content
Continuous rating scales may be less prone to the ceiling effect than discrete rating scales with fewer options to choose from ( Voutilainen et al. 2015 ). A ceiling effect is referred to the phenomenon where respondents select the top options, which results in little data variance.
Continuous rating scales may be less prone to the ceiling effect than discrete rating scales with fewer options to choose from (Voutilainen et al. 2015). A ceiling effect is referred to the phenomenon where respondents select the top options, which results in little data variance.
Content
Despite the benefits of using continuous rating scales, some researchers warn of technical drawbacks when using sliders:
Despite the benefits of using continuous rating scales, some researchers warn of technical drawbacks when using sliders:
Content
It may take longer for respondents to manipulate drag-and-drop sliders and complete survey items compared with the amount of time spent clicking radio buttons typically provided on discrete rating scales ( Cook et al. 2001 ; Couper et al. 2006 ).
It may take longer for respondents to manipulate drag-and-drop sliders and complete survey items compared with the amount of time spent clicking radio buttons typically provided on discrete rating scales (Cook et al. 2001; Couper et al. 2006).
Content
Sliders (drag-and-drop) produce more incomplete data (for example, respondents did not move the slider bar to indicate their own opinion) compared with clickable radio buttons ( Funke 2016 ).
Sliders (drag-and-drop) produce more incomplete data (for example, respondents did not move the slider bar to indicate their own opinion) compared with clickable radio buttons (Funke 2016).
Content
Sliders used on mobile phones have resulted in more nonresponses than sliders used on tablets or desktop computers ( Toepoel and Funke 2018 ).
Sliders used on mobile phones have resulted in more nonresponses than sliders used on tablets or desktop computers (Toepoel and Funke 2018).
Content
Respondents seem to find it difficult to move the sliding bar on a cell phone ( Antoun, Couper, and Conrad 2017 ).
Respondents seem to find it difficult to move the sliding bar on a cell phone (Antoun, Couper, and Conrad 2017).
Content
Also, be aware that not all sliders produce continuous data. Despite appearances, some sliders may be designed to make the marker snap between a limited number of grid lines. The data collection from a slider showing a range from zero to 100 may actually be as coarse as an 11-point scale if the marker placed between units of 10 rounds up or down. For example, while one slider as a continuous rating scale may record a value of 16.37, another may snap the marker placed at the same position up to 20, making it a discrete rating scale.
Also, be aware that not all sliders produce continuous data. Despite appearances, some sliders may be designed to make the marker snap between a limited number of grid lines. The data collection from a slider showing a range from zero to 100 may actually be as coarse as an 11-point scale if the marker placed between units of 10 rounds up or down. For example, while one slider as a continuous rating scale may record a value of 16.37, another may snap the marker placed at the same position up to 20, making it a discrete rating scale.
Content
So, research shows that sliders aren’t always cool to use or the most appropriate option for your task. You may want to avoid using sliders if your respondents are likely to complete your survey with a cell phone. Even when respondents are completing your survey on a desktop computer, you may have reasons to be concerned about the potential for nonresponses; for example, sliders may be more frustrating to use if respondents are tired, uninterested, or not technically savvy.
So, research shows that sliders aren’t always cool to use or the most appropriate option for your task. You may want to avoid using sliders if your respondents are likely to complete your survey with a cell phone. Even when respondents are completing your survey on a desktop computer, you may have reasons to be concerned about the potential for nonresponses; for example, sliders may be more frustrating to use if respondents are tired, uninterested, or not technically savvy.
Content
Point-and-click options consistently cause fewer frustrations for users than drag-and-drop options in the research we reviewed. Especially for respondents who have visual impairment or limited manual dexterity, sliders are not an appropriate choice. In other situations where you can ensure or expect that respondents would take time to carefully complete your survey, the use of sliders may help produce quality data with reduced ceiling effects and improved inter-reliability of data.
Point-and-click options consistently cause fewer frustrations for users than drag-and-drop options in the research we reviewed. Especially for respondents who have visual impairment or limited manual dexterity, sliders are not an appropriate choice. In other situations where you can ensure or expect that respondents would take time to carefully complete your survey, the use of sliders may help produce quality data with reduced ceiling effects and improved inter-reliability of data.
Content
This post is one in a series of articles that I present to help other practitioners make evidence-based decisions when designing surveys. For more information about using continuous rating scales, please see this article published by my research team at Boise State University’s Organizational Performance and Workplace Learning department.
This post is one in a series of articles that I present to help other practitioners make evidence-based decisions when designing surveys. For more information about using continuous rating scales, please see this article published by my research team at Boise State University’s Organizational Performance and Workplace Learning department.
References
Content
Antoun, C., M.P. Couper, and F.G. Conrad. 2017. “Effects of Mobile Versus PC Web on Survey Response Quality.” Public Opinion Quarterly 81 :280–306. https://doi.org/10.1093/poq/nfw088 .
Antoun, C., M.P. Couper, and F.G. Conrad. 2017. “Effects of Mobile Versus PC Web on Survey Response Quality.” Public Opinion Quarterly 81:280–306. https://doi.org/10.1093/poq/nfw088.
Content
Carey, J.L., T.J. Ganley, M.D. Milewski, J.D. Polousky, K.G. Shea, E.J. Wall, and A. Zbojniewicz. 2017. “The Reliability of Assessing Radiographic Healing of Osteochondritis Dissecans of the Knee.” The American Journal of Sports Medicine 45 (6): 1370–1375. https://doi.org/10.1177/0363546517698933 .
Carey, J.L., T.J. Ganley, M.D. Milewski, J.D. Polousky, K.G. Shea, E.J. Wall, and A. Zbojniewicz. 2017. “The Reliability of Assessing Radiographic Healing of Osteochondritis Dissecans of the Knee.” The American Journal of Sports Medicine 45(6): 1370–1375. https://doi.org/10.1177/0363546517698933.
Content
Conrad, F.G., M.P. Couper, E. Singer, and R. Tourangeau. 2006. “Evaluating the Effectiveness of Visual Analog Scales: A Web Experiment.” Social Science Computer Review 24 (2): 227–245. https://doi.org/10.1177/0894439305281503 .
Conrad, F.G., M.P. Couper, E. Singer, and R. Tourangeau. 2006. “Evaluating the Effectiveness of Visual Analog Scales: A Web Experiment.” Social Science Computer Review 24(2): 227–245. https://doi.org/10.1177/0894439305281503.
Content
Cook, C., F. Heath, R.L. Thompson, and B. Thompson. 2001. “Score Reliability in Web- or Internet-Based Surveys: Unnumbered Graphic Rating Scales Versus Likert-Type Scales.” Educational and Psychological Measurement 61 (4): 697–706. https://doi.org/10.1177/00131640121971356 .
Cook, C., F. Heath, R.L. Thompson, and B. Thompson. 2001. “Score Reliability in Web- or Internet-Based Surveys: Unnumbered Graphic Rating Scales Versus Likert-Type Scales.” Educational and Psychological Measurement 61(4): 697–706. https://doi.org/10.1177/00131640121971356.
Content
Funke, F. 2016. “A Web Experiment Showing Negative Effects of Slider Scales Compared to Visual Analogue Scales and Radio Button Scales.” Social Science Computer Review 34 (2): 244–254. https://doi.org/10.1177/0894439315575477 .
Funke, F. 2016. “A Web Experiment Showing Negative Effects of Slider Scales Compared to Visual Analogue Scales and Radio Button Scales.” Social Science Computer Review 34(2): 244–254. https://doi.org/10.1177/0894439315575477.
Content
Funke, F., and V. Toepoel. 2018. “Sliders, Visual Analogue Scales, or Buttons: Influence of Formats and Scales in Mobile and Desktop Surveys.” Mathematical Population Studies 25 (2): 112–122. https://doi.org/10.1080/08898480.2018.1439245 .
Funke, F., and V. Toepoel. 2018. “Sliders, Visual Analogue Scales, or Buttons: Influence of Formats and Scales in Mobile and Desktop Surveys.” Mathematical Population Studies 25(2): 112–122. https://doi.org/10.1080/08898480.2018.1439245.
Content
Kvist, T., T. Pitkäaho, K. Vehviläinen-Julkunen, and A. Voutilainen. 2015. “How to Ask About Patient Satisfaction? The Visual Analogue Scale Is Less Vulnerable to Confounding Factors and Ceiling Effect Than a Symmetric Likert Scale.” Journal of Advanced Nursing 72 (4): 946–957. https://doi.org/10.1111/jan.12875 .
Kvist, T., T. Pitkäaho, K. Vehviläinen-Julkunen, and A. Voutilainen. 2015. “How to Ask About Patient Satisfaction? The Visual Analogue Scale Is Less Vulnerable to Confounding Factors and Ceiling Effect Than a Symmetric Likert Scale.” Journal of Advanced Nursing 72(4): 946–957. https://doi.org/10.1111/jan.12875.