ATD Blog
Learning Analytics: The Analyze Phase
Thu Jan 07 2016

Content
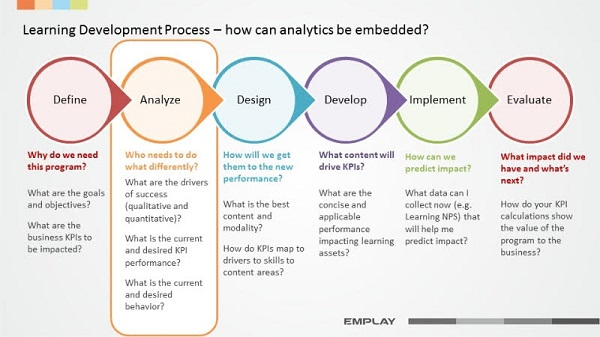
In our most recent post on learning analytics, “ Let the Data Tell You What You Need ,” we discussed the “define” step of learning program development. During the Define phase, objective-setting takes place, and the two to three key performance indicators (KPIs) are identified. These KPIs help measure progress toward the organizational goal.
In our most recent post on learning analytics, “Let the Data Tell You What You Need,” we discussed the “define” step of learning program development. During the Define phase, objective-setting takes place, and the two to three key performance indicators (KPIs) are identified. These KPIs help measure progress toward the organizational goal.
Content
During the Define phase, learning leaders use data to help evaluate the need for training and determine what business KPIs will be feel the impact of proposed programs. Define, then, is the prioritization phase, which is critically important early on.
During the Define phase, learning leaders use data to help evaluate the need for training and determine what business KPIs will be feel the impact of proposed programs. Define, then, is the prioritization phase, which is critically important early on.
Content
In the learning world, we often work ardently to deliver what people request without stopping to analyze the real potential impact. Using the techniques discussed in the Define phase, learning professionals can prioritize programs by determining which programs will have the biggest impact—and which programs should come first.
In the learning world, we often work ardently to deliver what people request without stopping to analyze the real potential impact. Using the techniques discussed in the Define phase, learning professionals can prioritize programs by determining which programs will have the biggest impact—and which programs should come first.
Content
On the heels of the Define phase comes the Analyze phase, which is when primary research and analysis begins. This is where analysis of the relationship between drivers of success (leading indicators) and current and desired KPI performance (lagging indicators) takes place. The goal during the Analyze phase is to overlay this quantitative information with qualitative behavioral data to create a rich context for learning programs as they were prioritized in the Define phase.
On the heels of the Define phase comes the Analyze phase, which is when primary research and analysis begins. This is where analysis of the relationship between drivers of success (leading indicators) and current and desired KPI performance (lagging indicators) takes place. The goal during the Analyze phase is to overlay this quantitative information with qualitative behavioral data to create a rich context for learning programs as they were prioritized in the Define phase.
Content
Obviously, data plays an important role in the Analyze phase, especially in revealing drivers of success and desired behavioral outcomes. The first questions learning leaders should ask as they begin their analysis are:
Obviously, data plays an important role in the Analyze phase, especially in revealing drivers of success and desired behavioral outcomes. The first questions learning leaders should ask as they begin their analysis are:
Content
What are the qualitative and quantitative drivers for success for this learning program?
What are the qualitative and quantitative drivers for success for this learning program?
Content
What behavioral results are we trying to achieve?
What behavioral results are we trying to achieve?
Content
Each KPI has drivers that are both quantitative and qualitative. Using retention, for example, determining these drivers would require identifying top-performing leaders for that specific KPI. It means asking, “Who are the top, bottom, and mid-level performers?”
Each KPI has drivers that are both quantitative and qualitative. Using retention, for example, determining these drivers would require identifying top-performing leaders for that specific KPI. It means asking, “Who are the top, bottom, and mid-level performers?”
Identifying and Correlating Desired Behaviors
Content
The Analyze phase examines the relationship between the KPIs, lagging indicators, and leading indicators. What is the crucial connection? The answer is simple: BEHAVIORS that drive the leading indicators. For instance, if retention is the KPI, and you’ve established that leadership trust is a driver of retention and that manager involvement in employee development is the behavior that increases leadership trust (and, in turn, retention), then the desired behavior of involvement is the driver of success.
The Analyze phase examines the relationship between the KPIs, lagging indicators, and leading indicators. What is the crucial connection? The answer is simple: BEHAVIORS that drive the leading indicators. For instance, if retention is the KPI, and you’ve established that leadership trust is a driver of retention and that manager involvement in employee development is the behavior that increases leadership trust (and, in turn, retention), then the desired behavior of involvement is the driver of success.
Content
Drilling down into the behaviors of the organization’s top performers can provide valuable information:
Drilling down into the behaviors of the organization’s top performers can provide valuable information:
Content
What are they doing well that’s tying to employee engagement?
What are they doing well that’s tying to employee engagement?
Content
How focused are they on retention?
How focused are they on retention?
Content
Are they more involved in the development of their employees than other leaders?
Are they more involved in the development of their employees than other leaders?
Content
The same exercise should be performed for mid-level and low-level performers. In this way, you can uncover the behaviors most likely to drive the KPIs you’ve identified.
The same exercise should be performed for mid-level and low-level performers. In this way, you can uncover the behaviors most likely to drive the KPIs you’ve identified.
Content
It’s also necessary to correlate the importance of the drivers with the impact on the KPIs, because they're not all created equally—and you don't want to assume that they are. It’s the leader's behavior that determines the driver, as well as the KPI performance. If your leaders don’t have an eye on the KPIs and drivers, then a low KPI performance is the likely result.
It’s also necessary to correlate the importance of the drivers with the impact on the KPIs, because they're not all created equally—and you don't want to assume that they are. It’s the leader's behavior that determines the driver, as well as the KPI performance. If your leaders don’t have an eye on the KPIs and drivers, then a low KPI performance is the likely result.
Case in Point
Content
While trying to understand the key behavioral changes to be influenced to improve retention, data analysis gave exceptional clarity to the stakeholders at a global technology company. They first established a benchmark retention rate by identifying top and bottom performing teams and managers and noting their overall retention rates, voluntary retention rates, and retention of high potentials over a two- to three-year period.
While trying to understand the key behavioral changes to be influenced to improve retention, data analysis gave exceptional clarity to the stakeholders at a global technology company. They first established a benchmark retention rate by identifying top and bottom performing teams and managers and noting their overall retention rates, voluntary retention rates, and retention of high potentials over a two- to three-year period.
Content
The analysts realized that:
The analysts realized that:
Content
Top managers had more high potentials on their teams than the bottom managers.
Top managers had more high potentials on their teams than the bottom managers.
Content
Top performing teams were able to retain up to 100 percent of their top performers over three years—against an average of 60 percent for the rest of employees.
Top performing teams were able to retain up to 100 percent of their top performers over three years—against an average of 60 percent for the rest of employees.
Content
Top performers had higher involuntary exits of low performers, whereas bottom managers had chronic low performers in the team.
Top performers had higher involuntary exits of low performers, whereas bottom managers had chronic low performers in the team.
Content
Next, the organization put together a qualitative and a quantitative study. The quantitative study included analyzing tenure of high potentials, rate of promotion, compensation increase, succession pipe, diversity in the team, goals completed, performance evaluation frequency, ESAT survey, training sign up and completion, and the LinkedIn profiles of high- and low-performing teams. The qualitative study included interviewing top and bottom managers on their hiring, training, managing, motivating, growing, and exiting processes and challenges.
Next, the organization put together a qualitative and a quantitative study. The quantitative study included analyzing tenure of high potentials, rate of promotion, compensation increase, succession pipe, diversity in the team, goals completed, performance evaluation frequency, ESAT survey, training sign up and completion, and the LinkedIn profiles of high- and low-performing teams. The qualitative study included interviewing top and bottom managers on their hiring, training, managing, motivating, growing, and exiting processes and challenges.
Content
The study clearly showed eight different key behaviors of top performing managers. Here’s a look at the top three behaviors:
The study clearly showed eight different key behaviors of top performing managers. Here’s a look at the top three behaviors:
Content
Top managers discussed careers, development goals, and training plans more frequently—evidenced by performance review data, training data, and manager interviews
Top managers discussed careers, development goals, and training plans more frequently—evidenced by performance review data, training data, and manager interviews
Content
Top managers took personal initiative to hire through their personally verified sources.
Top managers took personal initiative to hire through their personally verified sources.
Content
Top managers were quick to give feedback and were uncompromising on goals completion.
Top managers were quick to give feedback and were uncompromising on goals completion.
Content
Data Science on Tap -------------------- While the Analyze phase is a critical step to analytics-enabled learning development, not every organization has at their disposal the analytics resources to wrangle the data, perform the statistical analysis, and view that information through the lens of human capital performance. Larger organizations may have these capabilities internally, but many organizations lack the dedicated analytics resources required for these kinds of projects.
Data Science on Tap
-------------------- While the Analyze phase is a critical step to analytics-enabled learning development, not every organization has at their disposal the analytics resources to wrangle the data, perform the statistical analysis, and view that information through the lens of human capital performance. Larger organizations may have these capabilities internally, but many organizations lack the dedicated analytics resources required for these kinds of projects.
Content
Here are some strategies for obtaining the necessary level of analytics acumen for the Analyze phase:
Here are some strategies for obtaining the necessary level of analytics acumen for the Analyze phase:
Content
If you have a workforce analytics group, seek their help. There is likely someone who will understand what you’re trying to accomplish and can help with the analytics heavy lifting.
If you have a workforce analytics group, seek their help. There is likely someone who will understand what you’re trying to accomplish and can help with the analytics heavy lifting.
Content
Because marketing departments are generally early adopters of analytics, tap into your marketing analytics tools and talent for quantitative analysis.
Because marketing departments are generally early adopters of analytics, tap into your marketing analytics tools and talent for quantitative analysis.
Content
Get help externally from analytics resources that have done work specific to human capital, including consultants, quants, data scientists, data wranglers, statisticians, and so forth.
Get help externally from analytics resources that have done work specific to human capital, including consultants, quants, data scientists, data wranglers, statisticians, and so forth.
Content
Once you’ve aligned the success drivers, KPIs, and desired behaviors. Your learning organization will have a firm foundation to formalize your learning objectives in the next phase. Stay tuned for our next post on the Design phase; we will focus on how to use analytics to obtain improved performance from employees?
Once you’ve aligned the success drivers, KPIs, and desired behaviors. Your learning organization will have a firm foundation to formalize your learning objectives in the next phase. Stay tuned for our next post on the Design phase; we will focus on how to use analytics to obtain improved performance from employees?
Content
**
**
Zoom in on Behavior That Drives Performance
Content
**Several strategies can help in objectively identifying high performers and assessing the gaps that exist between top, bottom, and mid-level performers. This analysis is valuable for setting training objectives:
**Several strategies can help in objectively identifying high performers and assessing the gaps that exist between top, bottom, and mid-level performers. This analysis is valuable for setting training objectives:
Content
Analyze the KPIs and determine what program might drive them.
Analyze the KPIs and determine what program might drive them.
Content
Consider what kind of changes in behavior the program should generate.
Consider what kind of changes in behavior the program should generate.
Content
Develop and deliver a questionnaire of 100-200 generic questions to collect information from leaders who are doing well to better understand the challenge areas for leaders who are not doing well in specific areas.
Develop and deliver a questionnaire of 100-200 generic questions to collect information from leaders who are doing well to better understand the challenge areas for leaders who are not doing well in specific areas.
Content
Elicit contributions from both low- and high-performing leaders on what needs to be done differently.
Elicit contributions from both low- and high-performing leaders on what needs to be done differently.
Content
Analyze the qualities of top leaders; for example, who has the longest retention, the best promotion trajectory, whose group is growing, whose group is retaining people, whose teams are diverse, and so forth.
Analyze the qualities of top leaders; for example, who has the longest retention, the best promotion trajectory, whose group is growing, whose group is retaining people, whose teams are diverse, and so forth.
Content
Define the patterns and types of behaviors that drive performance.
Define the patterns and types of behaviors that drive performance.
Content