TD Magazine Article
Member Benefit
Compare and Contrast
Content
Use the State of the Industry report to see how your L&D data holds up against industry trends.
Use the State of the Industry report to see how your L&D data holds up against industry trends.
Mon Dec 02 2024
![Typical Breakdown of a Talent Development Budget [a pie chart broken out by percentage] Internal costs: 57%; learning supplier expenses: 27%; tuition reimbursement: 16% SOURCE: 2024 STATE OF THE INDUSTRY
REPORT, ATD](https://assets.td.org/transform/67f0e4e4-b39c-4a44-aae3-09e9f27040b7/Feature5_Dec24)
Content
The Association for Talent Development's annual State of the Industry report tracks TD spending and activities and gives organizations data to use as a benchmark for designing their training agenda and budgeting for TD programs. You may be saying to yourself, "That sounds great, in theory, but how do I compare my data to the industry averages and then use the data to make a strong business case to support TD?"
The Association for Talent Development's annual State of the Industry report tracks TD spending and activities and gives organizations data to use as a benchmark for designing their training agenda and budgeting for TD programs. You may be saying to yourself, "That sounds great, in theory, but how do I compare my data to the industry averages and then use the data to make a strong business case to support TD?"
Content
To answer that question, ATD Research contacted two subject matter experts who use the State of the Industry report as a tool to understand the TD function. Kimo Kippen, president of Aloha Learning Advisors, has created learning solutions for thousands of people worldwide. And Lou Tedrick, vice president of global L&D at Verizon, leads a large team responsible for curriculum and content curation, learning effectiveness, learning technology, and reporting and analytics.
To answer that question, ATD Research contacted two subject matter experts who use the State of the Industry report as a tool to understand the TD function. Kimo Kippen, president of Aloha Learning Advisors, has created learning solutions for thousands of people worldwide. And Lou Tedrick, vice president of global L&D at Verizon, leads a large team responsible for curriculum and content curation, learning effectiveness, learning technology, and reporting and analytics.
Definitions matter
Content
The State of the Industry report gives TD professionals a snapshot of industry trends. It includes benchmarking data on average learning hours, expenditures, content distribution, and delivery methods. The report also presents information about measuring the impact of learning. When benchmarking data, Kippen explains, "what is really important is that you always compare apples to apples."
The State of the Industry report gives TD professionals a snapshot of industry trends. It includes benchmarking data on average learning hours, expenditures, content distribution, and delivery methods. The report also presents information about measuring the impact of learning. When benchmarking data, Kippen explains, "what is really important is that you always compare apples to apples."
Content
The report includes the definitions of terms and an explanation of how to calculate the various data points to help organizations make proper comparisons against the averages. For example, the 2024 State of the Industry report notes that:
The report includes the definitions of terms and an explanation of how to calculate the various data points to help organizations make proper comparisons against the averages. For example, the 2024 State of the Industry report notes that:
Content
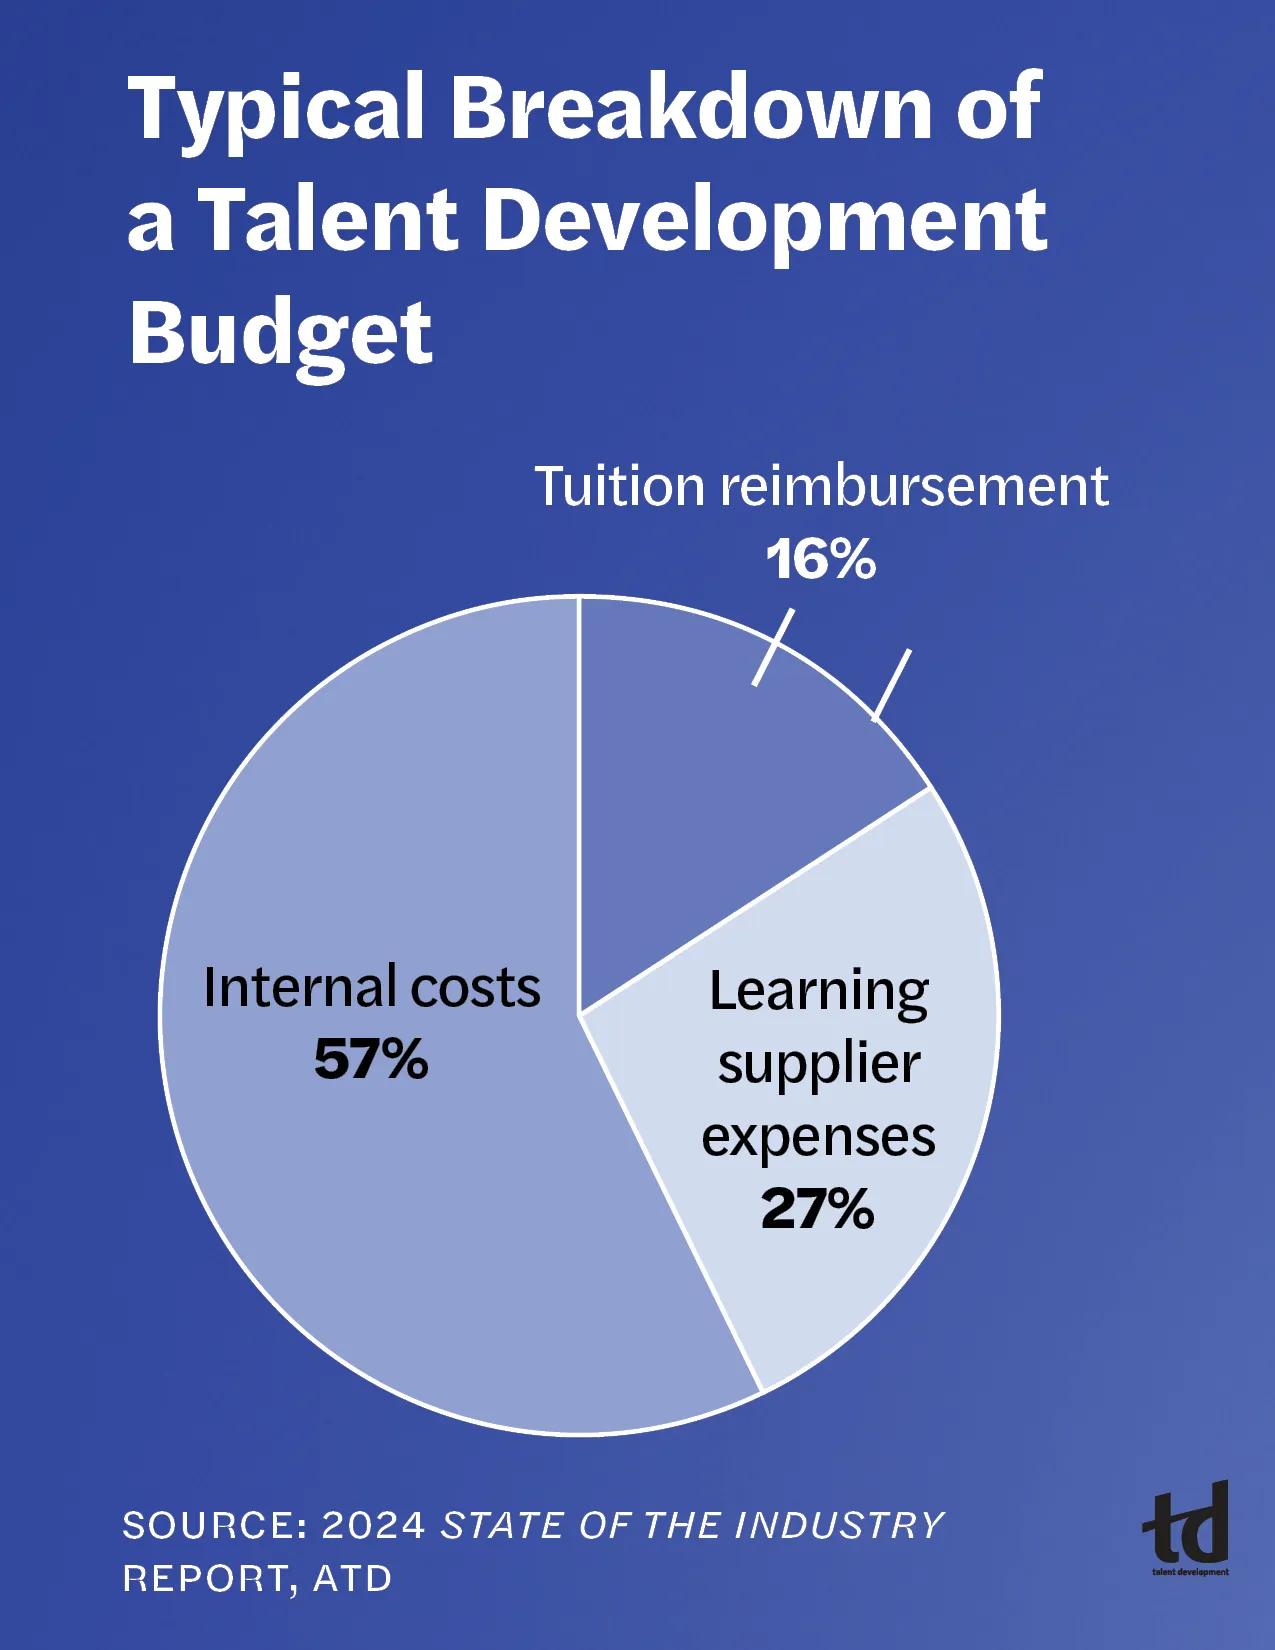
Sixteen percent of TD's budget expenditure is on tuition reimbursement (which ATD defines as the costs of programs and courses at community colleges and universities and continuing professional education or certification).
Sixteen percent of TD's budget expenditure is on tuition reimbursement (which ATD defines as the costs of programs and courses at community colleges and universities and continuing professional education or certification).
Content
Twenty-seven percent of TD's budget expenditure is on learning supplier expenses (which ATD defines as costs of consultants and services, content development and licenses, and workshops and training programs delivered by outside providers).
Twenty-seven percent of TD's budget expenditure is on learning supplier expenses (which ATD defines as costs of consultants and services, content development and licenses, and workshops and training programs delivered by outside providers).
Content
Fifty-seven percent of TD's budget expenditure is on internal costs (which ATD defines as costs of TD staff salaries [including taxes and benefits], travel costs for TD staff, administrative costs, nonsalary development costs, and nonsalary delivery costs [such as classroom facilities or online infrastructure]).
Fifty-seven percent of TD's budget expenditure is on internal costs (which ATD defines as costs of TD staff salaries [including taxes and benefits], travel costs for TD staff, administrative costs, nonsalary development costs, and nonsalary delivery costs [such as classroom facilities or online infrastructure]).
Content
"We'll look at ATD's numbers, and then we calculate our numbers the same way," Tedrick says. "That way we're able to see, comparatively, how we're doing against similar organizations." The State of the Industry report provides an appendix of data by company size and industry. Tedrick notes that, as a large company (defined as 2,500 or more employees), Verizon benchmarks its TD data against other large organizations along with a comparison to the consolidated data points.
"We'll look at ATD's numbers, and then we calculate our numbers the same way," Tedrick says. "That way we're able to see, comparatively, how we're doing against similar organizations." The State of the Industry report provides an appendix of data by company size and industry. Tedrick notes that, as a large company (defined as 2,500 or more employees), Verizon benchmarks its TD data against other large organizations along with a comparison to the consolidated data points.
What if there's a data mismatch?
Content
Having the parameters and definitions handy are helpful so that you can calculate how your TD function is using its budget. Although your percentages may be slightly different from the report's data, the reason could be because of your organization's size, industry, or location. The purpose of the exercise isn't to replicate the data but to have a data point for comparison. For example, if your TD function added a new learning technology this year, you may find that your internal costs were a larger percentage of your budget than the average company.
Having the parameters and definitions handy are helpful so that you can calculate how your TD function is using its budget. Although your percentages may be slightly different from the report's data, the reason could be because of your organization's size, industry, or location. The purpose of the exercise isn't to replicate the data but to have a data point for comparison. For example, if your TD function added a new learning technology this year, you may find that your internal costs were a larger percentage of your budget than the average company.
Content
Another example of a mismatch would be if you introduced a new mandatory training program in which all employees participated. That initiative could make your learning hours skew higher than the industry averages. The workplace culture can also affect the averages. If your organization has a strong learning culture, you may find that staff are participating in more learning hours.
Another example of a mismatch would be if you introduced a new mandatory training program in which all employees participated. That initiative could make your learning hours skew higher than the industry averages. The workplace culture can also affect the averages. If your organization has a strong learning culture, you may find that staff are participating in more learning hours.
Content
The act of calculating the averages won't tell you the full story behind the data. Determining the reason that they are higher or lower than the industry averages is a key element in understanding your data.
The act of calculating the averages won't tell you the full story behind the data. Determining the reason that they are higher or lower than the industry averages is a key element in understanding your data.
Content
Tedrick mentions that her metrics don't always match ATD's benchmarks. Verizon's L&D team supports two different groups; therefore, "We look at our data two ways," she says. "For just the internal learning population, and then … with the internal and the external population, which is really who we serve." Verizon's external learners include resellers, customers, and business process outsourcing partners.
Tedrick mentions that her metrics don't always match ATD's benchmarks. Verizon's L&D team supports two different groups; therefore, "We look at our data two ways," she says. "For just the internal learning population, and then … with the internal and the external population, which is really who we serve." Verizon's external learners include resellers, customers, and business process outsourcing partners.
Content
"The ATD data gives us a comparison number for the internal learners. And then we can say, ‘But, with the external learners, we support more people,'" Tedrick continues. The key is understanding why the data is different and having an explanation ready.
"The ATD data gives us a comparison number for the internal learners. And then we can say, ‘But, with the external learners, we support more people,'" Tedrick continues. The key is understanding why the data is different and having an explanation ready.
Content
Further, Tedrick notes that it's important to consider where the TD function is situated in an organization and whether the function is centralized (reporting to one leader) or decentralized (ownership of learning initiatives falls to the individual business units or departments). Those factors could potentially change how you report data.
Further, Tedrick notes that it's important to consider where the TD function is situated in an organization and whether the function is centralized (reporting to one leader) or decentralized (ownership of learning initiatives falls to the individual business units or departments). Those factors could potentially change how you report data.
Content
According to the 2024 report:
According to the 2024 report:
Content
Forty percent of responding organizations have a TD or learning department.
Forty percent of responding organizations have a TD or learning department.
Content
Forty-two percent said their TD function is part of the HR department.
Forty-two percent said their TD function is part of the HR department.
Content
Ten percent said they have a decentralized department.
Ten percent said they have a decentralized department.
Content
Eight percent said their department has some other setup.
Eight percent said their department has some other setup.
Tell your data story
Content
You can also use the State of the Industry report to help tell the TD function's story. "Traditionally, learning doesn't do the best job in self-marketing or self-promoting and telling their story," Kippen states. He suggests that TD professionals use the data to show the "operational excellence of a learning function to show efficiency and effectiveness."
You can also use the State of the Industry report to help tell the TD function's story. "Traditionally, learning doesn't do the best job in self-marketing or self-promoting and telling their story," Kippen states. He suggests that TD professionals use the data to show the "operational excellence of a learning function to show efficiency and effectiveness."
Content
For instance, if your company has a higher number of learning hours compared to similar types of companies, that may indicate a strong learning culture. Your employer could then use that fact to help recruit new employees by highlighting the importance of learning at the organization.
For instance, if your company has a higher number of learning hours compared to similar types of companies, that may indicate a strong learning culture. Your employer could then use that fact to help recruit new employees by highlighting the importance of learning at the organization.
Content
Or consider whether staffing within your TD function increased. According to the report, only 34 percent of organizations increased their TD department headcount in 2023, so an increase in your company would indicate that organizational leadership is invested in TD.
Or consider whether staffing within your TD function increased. According to the report, only 34 percent of organizations increased their TD department headcount in 2023, so an increase in your company would indicate that organizational leadership is invested in TD.
Content
Tedrick relays the importance of the words her team uses in its data story. "We have tried to change the terminology a bit," she explains. "We are trying to talk about talent development as an investment versus a cost, and I find that to be a very different conversation."
Tedrick relays the importance of the words her team uses in its data story. "We have tried to change the terminology a bit," she explains. "We are trying to talk about talent development as an investment versus a cost, and I find that to be a very different conversation."
Content
For example, Tedrick shares, "When we talked about a retail leadership program, the cost per person was $1,500, and stakeholders said, That costs a lot of money.' When I asked them if they would invest $1,500 on store leaders who are responsible for generating substantial revenue, that flipped the conversation." Although the State of the Industry report uses the terms expenditure and cost, you may find it useful to use investment when telling your data story.
For example, Tedrick shares, "When we talked about a retail leadership program, the cost per person was $1,500, and stakeholders said, That costs a lot of money.' When I asked them if they would invest $1,500 on store leaders who are responsible for generating substantial revenue, that flipped the conversation." Although the State of the Industry report uses the terms expenditure and cost, you may find it useful to use investment when telling your data story.
Content
Kippen advises TD professionals to also think about "How did talent development move the business forward?" Use the data points from the report to support your data and how your TD team was able to make improvements for the business's bottom line.
Kippen advises TD professionals to also think about "How did talent development move the business forward?" Use the data points from the report to support your data and how your TD team was able to make improvements for the business's bottom line.
Content
Metrics that may be useful to doing so are the number of learning hours used per employee, direct expenditure per employee, or the cost per learning hour. For instance, learning hours used per employee indicates that staff are learning new skills. Such skills can help make the business more effective or efficient. The direct expenditure per employee is the average investment an organization makes to help staff learn. Although your company may have spent more per staff member, that may have helped the business recognize more revenue. Cost per learning hour can demonstrate how efficient the TD team is with its budget.
Metrics that may be useful to doing so are the number of learning hours used per employee, direct expenditure per employee, or the cost per learning hour. For instance, learning hours used per employee indicates that staff are learning new skills. Such skills can help make the business more effective or efficient. The direct expenditure per employee is the average investment an organization makes to help staff learn. Although your company may have spent more per staff member, that may have helped the business recognize more revenue. Cost per learning hour can demonstrate how efficient the TD team is with its budget.
Where to begin
Content
The most important advice Tedrick offers is to consider "What is important to your organization? What are the metrics that are important to stakeholders?" The State of the Industry report has a lot of information, and you may not have all the data for your company. Therefore, "Start small, and look at the data that are important to your business," Tedrick suggests.
The most important advice Tedrick offers is to consider "What is important to your organization? What are the metrics that are important to stakeholders?" The State of the Industry report has a lot of information, and you may not have all the data for your company. Therefore, "Start small, and look at the data that are important to your business," Tedrick suggests.
Content
When you review each data point in the report, determine two things:
When you review each data point in the report, determine two things:
Content
Do you have the data available at your organization to calculate the comparable data point?
Do you have the data available at your organization to calculate the comparable data point?
Content
Will the data point be useful for stakeholders?
Will the data point be useful for stakeholders?
Content
Once you identify what you want to compare, use the equations in the report to calculate your company's data. Next, compare the numbers to the consolidated averages before moving to the appendix to make comparisons to the corresponding organization size or industry that matches your company.
Once you identify what you want to compare, use the equations in the report to calculate your company's data. Next, compare the numbers to the consolidated averages before moving to the appendix to make comparisons to the corresponding organization size or industry that matches your company.
Content
If your numbers are significantly higher or lower, do you know why? Think about how you can tell your TD success story.
If your numbers are significantly higher or lower, do you know why? Think about how you can tell your TD success story.
Content
Next year, calculate the same data points again, which will start you on the journey to examine organizational trends. The historical data can provide additional context to understand what is normal for your company.
Next year, calculate the same data points again, which will start you on the journey to examine organizational trends. The historical data can provide additional context to understand what is normal for your company.
Content
"What's really nice about the State of the Industry report is its trend data over a long period of time," Kippen notes. "It creates a good grounding base [on] which you can use comparative data."
"What's really nice about the State of the Industry report is its trend data over a long period of time," Kippen notes. "It creates a good grounding base [on] which you can use comparative data."
Selecting the Appropriate Benchmarking Data
Content
Suppose your company's leadership team requests the number of learning hours used per employee on a yearly basis, and the company encourages staff to participate in a specific number of learning hours each year. The scenario demonstrates that the metric is important to your organization and that the talent development department collects that data (likely in the learning management system, where TD staff can access it).
Suppose your company's leadership team requests the number of learning hours used per employee on a yearly basis, and the company encourages staff to participate in a specific number of learning hours each year. The scenario demonstrates that the metric is important to your organization and that the talent development department collects that data (likely in the learning management system, where TD staff can access it).
Content
Those two facts are indications that comparing that metric to the industry averages from the Association for Talent Development's State of the Industry report would be a valuable exercise for your TD team.
Those two facts are indications that comparing that metric to the industry averages from the Association for Talent Development's State of the Industry report would be a valuable exercise for your TD team.
Content
ATD calculates learning hours used per employee by using this equation:
ATD calculates learning hours used per employee by using this equation:
Content
(length of training in hours x number of learners in session) + (length of training in hours x number of learners in session)
(length of training in hours x number of learners in session) + (length of training in hours x number of learners in session)
Content
Total number of full-time employees
Total number of full-time employees
Content
For the numerator (the top portion of the equation), you'll need to calculate the length of training multiplied by the number of learners in the session for every training program in 2023. To make apples-to-apples comparisons, you must calculate the average the same way as ATD.
For the numerator (the top portion of the equation), you'll need to calculate the length of training multiplied by the number of learners in the session for every training program in 2023. To make apples-to-apples comparisons, you must calculate the average the same way as ATD.
Content
After you have your figure, compare it to the consolidated average, and then to the corresponding organization size and industry. Reasons that a company's number may be higher than the average include:
After you have your figure, compare it to the consolidated average, and then to the corresponding organization size and industry. Reasons that a company's number may be higher than the average include:
Content
The organization has more mandatory or compliance training programs than other companies.
The organization has more mandatory or compliance training programs than other companies.
Content
It has an organizational culture that values learning.
It has an organizational culture that values learning.
Content
Factors that can contribute to a lower number than the industry average are:
Factors that can contribute to a lower number than the industry average are:
Content
The company was understaffed and employees didn't have time to focus on learning.
The company was understaffed and employees didn't have time to focus on learning.
Content
It has a seasoned staff who may not need a lot of new training.
It has a seasoned staff who may not need a lot of new training.
Content
Whatever your company's reasons, use them to formulate the story behind your data.
Whatever your company's reasons, use them to formulate the story behind your data.
Content
Download the 2024 State of the Industry report at td.org/SOIR.
Download the 2024 State of the Industry report at td.org/SOIR.