TD Magazine Article
Member Benefit
DEI Data Has a Story to Tell
Content
Beyond a variety of numbers and statistics, DEI data represents people and holds the power to effect change.
Beyond a variety of numbers and statistics, DEI data represents people and holds the power to effect change.
Fri Jun 30 2023
Content
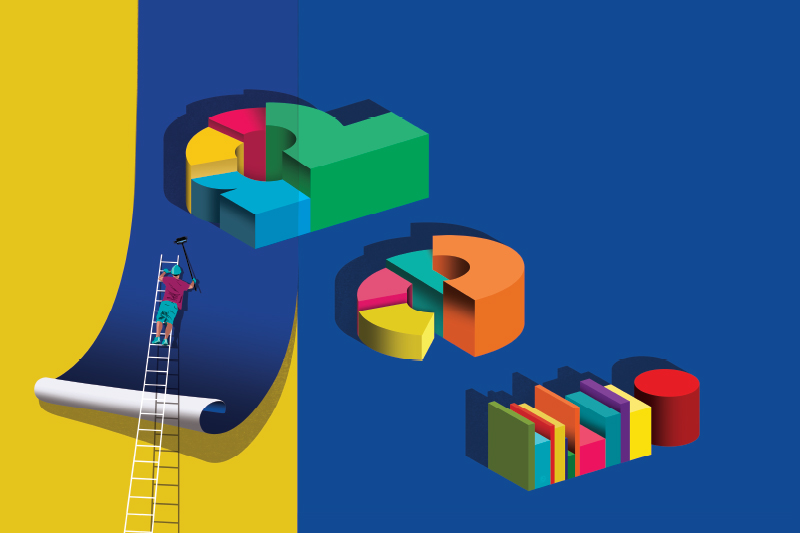
Data storytelling is an essential tool for building a shared understanding of diversity, equity, and inclusion challenges and opportunities as well as driving meaningful change in organizations. However, DEI and talent development leaders often rely on boring talent data dashboards and PowerPoint presentations that fail to inspire action. Simply using data alone won't drive change.
Data storytelling is an essential tool for building a shared understanding of diversity, equity, and inclusion challenges and opportunities as well as driving meaningful change in organizations. However, DEI and talent development leaders often rely on boring talent data dashboards and PowerPoint presentations that fail to inspire action. Simply using data alone won't drive change.