TD Magazine Article
Member Benefit
Get Your TD Yardstick Ready
Content
Benchmark your company’s talent development data against industry standards from ATD’s 2023 State of the Industry report.
Benchmark your company’s talent development data against industry standards from ATD’s 2023 State of the Industry report.
Fri Dec 01 2023

Content
Benchmark your company's talent development data against industry standards from ATD's 2023 State of the Industry report.
Benchmark your company's talent development data against industry standards from ATD's 2023 State of the Industry report.
Content
Envision you're sitting at your desk, drinking your morning cup of coffee, when your computer pings with a new email from your organization's chief talent development officer. In the email is a link to the Association for Talent Development's 2023 State of the Industry report, which is an annual review of TD trends, spending, and activities that can help benchmark your team's work. Your CTDO wants to know how your organization is faring compared to the averages in the report. "And," the CTDO writes, "can you prepare to present the comparative data to the executives at their quarterly meeting next month?" If reading that scenario made your palms start sweating, you aren't alone.
Envision you're sitting at your desk, drinking your morning cup of coffee, when your computer pings with a new email from your organization's chief talent development officer. In the email is a link to the Association for Talent Development's 2023 State of the Industry report, which is an annual review of TD trends, spending, and activities that can help benchmark your team's work. Your CTDO wants to know how your organization is faring compared to the averages in the report. "And," the CTDO writes, "can you prepare to present the comparative data to the executives at their quarterly meeting next month?" If reading that scenario made your palms start sweating, you aren't alone.
Content
In a recent study of the Talent Development Capability Model, ATD Research asked TD professionals to rate their abilities in data and analytics. As the 2023 Talent Development Skills and Capabilities report reveals, only 25 percent of respondents said they would consider themselves an expert or advanced, 39 percent considered themselves to be capable, and 36 percent said they were exploring or informed about the topic. Of the 23 capabilities in the Capability Model, data and analytics had the lowest percentage of respondents who rated themselves as an expert or advanced.
In a recent study of the Talent Development Capability Model, ATD Research asked TD professionals to rate their abilities in data and analytics. As the 2023 Talent Development Skills and Capabilities report reveals, only 25 percent of respondents said they would consider themselves an expert or advanced, 39 percent considered themselves to be capable, and 36 percent said they were exploring or informed about the topic. Of the 23 capabilities in the Capability Model, data and analytics had the lowest percentage of respondents who rated themselves as an expert or advanced.
Content
Considering that, allow me to take you on a step-by-step journey on how to collect, benchmark, and present your data.
Considering that, allow me to take you on a step-by-step journey on how to collect, benchmark, and present your data.
Step 1: Collect the data
Content
Begin by reading the 2023 State of the Industry report. Many data points are in it and you'll need to understand how ATD defines each one so that you can collect similar information from your company.
Begin by reading the 2023 State of the Industry report. Many data points are in it and you'll need to understand how ATD defines each one so that you can collect similar information from your company.
Content
Drawing upon a sample of 454 organizations, this year's report presents results that demonstrate what happened in TD in 2022. You—and your executive team—may wonder why the data is a year behind. The reason the 2023 report highlights 2022 data is because ATD Research sends out the survey after the calendar year is over, which is also a fiscal year for some companies.
Drawing upon a sample of 454 organizations, this year's report presents results that demonstrate what happened in TD in 2022. You—and your executive team—may wonder why the data is a year behind. The reason the 2023 report highlights 2022 data is because ATD Research sends out the survey after the calendar year is over, which is also a fiscal year for some companies.
Content
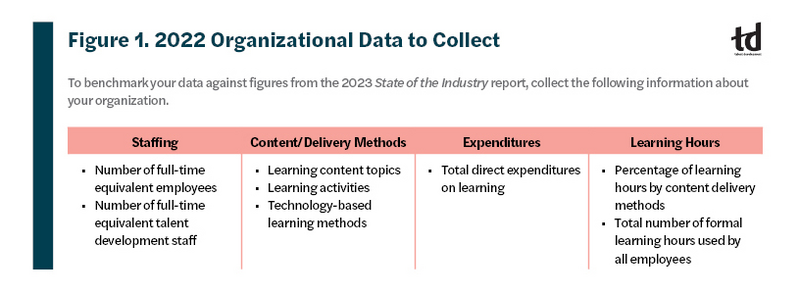
The 2022 data you will need to collect about your organization fits into four categories: staffing, content/delivery methods, expenditures, and learning hours (see Figure 1). It may be helpful to start a spreadsheet to collect this data in one, convenient place.
The 2022 data you will need to collect about your organization fits into four categories: staffing, content/delivery methods, expenditures, and learning hours (see Figure 1). It may be helpful to start a spreadsheet to collect this data in one, convenient place.
Content
Let's start with collecting employment numbers. Document the number of full-time equivalent employees at your organization in 2022 and the number of full-time equivalent TD staff.
Let's start with collecting employment numbers. Document the number of full-time equivalent employees at your organization in 2022 and the number of full-time equivalent TD staff.
Content
Next is collecting information that may be a little more difficult to amass: data related to the learning content provided in 2022. For each of the content areas—including executive development, customer service, and interpersonal skills—think about whether your organization provided none, some, or the majority of content. Determine the percentage of learning hours your TD team delivered via a variety of learning methods, including e-learning, blended learning, hybrid learning, traditional classroom, and virtual classroom. When calculating the percentage, your total should be 100 percent. If you don't use one of the learning methods, mark it down as 0 percent.
Next is collecting information that may be a little more difficult to amass: data related to the learning content provided in 2022. For each of the content areas—including executive development, customer service, and interpersonal skills—think about whether your organization provided none, some, or the majority of content. Determine the percentage of learning hours your TD team delivered via a variety of learning methods, including e-learning, blended learning, hybrid learning, traditional classroom, and virtual classroom. When calculating the percentage, your total should be 100 percent. If you don't use one of the learning methods, mark it down as 0 percent.
Content
Another data point to gather is the type of delivery methods your company used to develop employees. That includes coaching, mentoring, job shadowing, rotational training, and stretch assignments. For each activity, record whether your organization uses it frequently, sometimes, or not at all.
Another data point to gather is the type of delivery methods your company used to develop employees. That includes coaching, mentoring, job shadowing, rotational training, and stretch assignments. For each activity, record whether your organization uses it frequently, sometimes, or not at all.
Content
Does your company use technology-based learning methods, such as artificial intelligence applications, immersive technologies, or podcasts and video? For each method, document whether your organization:
Does your company use technology-based learning methods, such as artificial intelligence applications, immersive technologies, or podcasts and video? For each method, document whether your organization:
Content
Currently uses it
Currently uses it
Content
Previously used it and stopped
Previously used it and stopped
Content
Planned to implement it in 2023
Planned to implement it in 2023
Content
Is learning about it but has no plans to implement it
Is learning about it but has no plans to implement it
Content
Has no plans to learn about or implement it
Has no plans to learn about or implement it
Content
I've saved the most challenging data for last: total expenditures and learning hours used in 2022. Collect information about your total direct expenditures on learning in US dollars in 2022. Total direct expenditures include TD staff salaries (gross wages including benefits or employer-paid taxes), travel costs for TD staff, administrative costs, nonsalary development costs, nonsalary delivery costs (such as classroom facilities and online infrastructure), outsourced activities, and tuition reimbursement. Total direct expenditures do not include learners' travel expenses; costs of participants' conference attendance, fees, and travel; nor cost of lost work time while staff engaged in learning activities.
I've saved the most challenging data for last: total expenditures and learning hours used in 2022. Collect information about your total direct expenditures on learning in US dollars in 2022. Total direct expenditures include TD staff salaries (gross wages including benefits or employer-paid taxes), travel costs for TD staff, administrative costs, nonsalary development costs, nonsalary delivery costs (such as classroom facilities and online infrastructure), outsourced activities, and tuition reimbursement. Total direct expenditures do not include learners' travel expenses; costs of participants' conference attendance, fees, and travel; nor cost of lost work time while staff engaged in learning activities.
Content
To calculate the total direct learning expenditure used for learning suppliers, include data on consultants and services, external content development and licenses, and workshops and training programs delivered by external providers. Do not include tuition reimbursement.
To calculate the total direct learning expenditure used for learning suppliers, include data on consultants and services, external content development and licenses, and workshops and training programs delivered by external providers. Do not include tuition reimbursement.
Content
Further, to determine the percentage of the total direct learning expenditure for tuition reimbursement and education assistance, collect data on community college courses and programs, university courses and programs, and continuing professional education or certification. Direct learning expenditure does not include training courses provided by vendors and consultants.
Further, to determine the percentage of the total direct learning expenditure for tuition reimbursement and education assistance, collect data on community college courses and programs, university courses and programs, and continuing professional education or certification. Direct learning expenditure does not include training courses provided by vendors and consultants.
Content
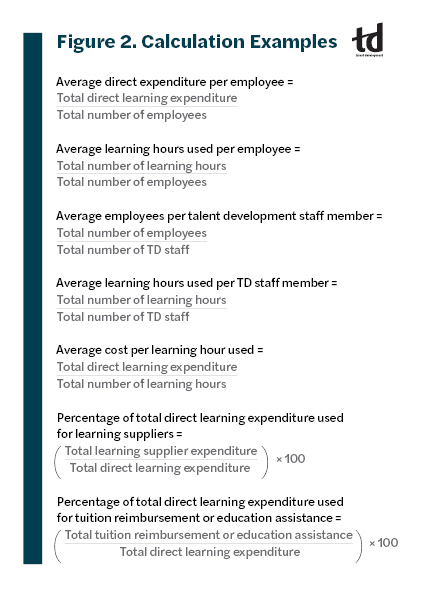
One last data point to locate and calculate is the total number of formal learning hours employees used in 2022. For example, if 100 employees took an eight-hour workshop, multiply 100 by 8, which equals 800 hours. Do that for each formal learning opportunity in 2022 and then add them together, which will give you the total number of formal learning hours used. Figure 2 includes the calculations for additional data points to determine based on the above information you've collected.
One last data point to locate and calculate is the total number of formal learning hours employees used in 2022. For example, if 100 employees took an eight-hour workshop, multiply 100 by 8, which equals 800 hours. Do that for each formal learning opportunity in 2022 and then add them together, which will give you the total number of formal learning hours used. Figure 2 includes the calculations for additional data points to determine based on the above information you've collected.
Step 2: Benchmark the data
Content
It's time to start comparing your company's data to the 2023 State of the Industry report. Before you begin, keep in mind that the data points provided in the report are averages across all types and sizes of organizations. Your data won't exactly match the data in the report; therefore, use the information to better understand your company's learning expenditures and activities—and next year, do the exercise again to record year-over-year data for your organization.
It's time to start comparing your company's data to the 2023 State of the Industry report. Before you begin, keep in mind that the data points provided in the report are averages across all types and sizes of organizations. Your data won't exactly match the data in the report; therefore, use the information to better understand your company's learning expenditures and activities—and next year, do the exercise again to record year-over-year data for your organization.
Content
The 2023 report presents overall averages as well as data that is a little more nuanced. For most sections, ATD Research presents data by organization size and by industry group. Although you can benchmark from the overall averages, comparing your organization to companies that are like your size or industry may provide more accurate benchmarking data.
The 2023 report presents overall averages as well as data that is a little more nuanced. For most sections, ATD Research presents data by organization size and by industry group. Although you can benchmark from the overall averages, comparing your organization to companies that are like your size or industry may provide more accurate benchmarking data.
Content
According to the report, during 2022, the average direct expenditure across all organizations was $1,220 per employee. That dollar amount drastically changes when you look at the average spent per employee by organization size.
According to the report, during 2022, the average direct expenditure across all organizations was $1,220 per employee. That dollar amount drastically changes when you look at the average spent per employee by organization size.
Content
Small organizations (with fewer than 100 employees) spent $1,814 per employee; medium organizations (between 100 and 2,499 employees) spent $1,121 per employee; and large organizations (with 2,500 or more employees) spent the least, at $809 per employee. Larger companies can spend less per staff member because the cost of learning is spread out across more people. Seeing the differences by organizational size confirms why comparing to like-size companies can be helpful.
Small organizations (with fewer than 100 employees) spent $1,814 per employee; medium organizations (between 100 and 2,499 employees) spent $1,121 per employee; and large organizations (with 2,500 or more employees) spent the least, at $809 per employee. Larger companies can spend less per staff member because the cost of learning is spread out across more people. Seeing the differences by organizational size confirms why comparing to like-size companies can be helpful.
Content
ATD Research found that the cost per learning hour has continued to increase since 2020. In 2022, the cost was $115 per learning hour, which was a $12 increase over 2021. The report reveals that while companies have seen a decrease in their expenditure per employee from 2021 ($1,280) to 2022 ($1,220), they have had to make those dollars stretch even further as the cost per learning hour increased.
ATD Research found that the cost per learning hour has continued to increase since 2020. In 2022, the cost was $115 per learning hour, which was a $12 increase over 2021. The report reveals that while companies have seen a decrease in their expenditure per employee from 2021 ($1,280) to 2022 ($1,220), they have had to make those dollars stretch even further as the cost per learning hour increased.
Content
As you look at your TD budget, do you see similar trends? The good news is that when ATD Research asked respondents to think about the future, most TD professionals said they expect their budget to either increase or stay the same. Only 5 percent expect a decrease in their budgets.
As you look at your TD budget, do you see similar trends? The good news is that when ATD Research asked respondents to think about the future, most TD professionals said they expect their budget to either increase or stay the same. Only 5 percent expect a decrease in their budgets.
Content
Compare your numbers to the benchmarking data. Is your data higher or lower than the averages? Are you able to identify a reason the numbers are similar or different? If you are struggling with determining why your data is different, think about your organization's learning culture—does your company place a strong emphasis on the importance of TD? Another reason your data may differ is due to industry. Although the report provides some industry information, perhaps your industry has different norms. Finally, think about regional differences. You may expect your numbers to be higher or lower based on where your organization is headquartered. Take consideration of any conclusions as you start making future plans for TD at your company.
Compare your numbers to the benchmarking data. Is your data higher or lower than the averages? Are you able to identify a reason the numbers are similar or different? If you are struggling with determining why your data is different, think about your organization's learning culture—does your company place a strong emphasis on the importance of TD? Another reason your data may differ is due to industry. Although the report provides some industry information, perhaps your industry has different norms. Finally, think about regional differences. You may expect your numbers to be higher or lower based on where your organization is headquartered. Take consideration of any conclusions as you start making future plans for TD at your company.
Step 3: Present the data
Content
Now that you have gathered and benchmarked data as well as determined why your data is similar or different, put all the information into a presentation to the executive team.
Now that you have gathered and benchmarked data as well as determined why your data is similar or different, put all the information into a presentation to the executive team.
Content
Think about the organizational culture and how company leaders prefer to receive data. If your leadership team is interested in seeing detailed information with explanations, consider drafting a report that is similar to the State of the Industry. Perhaps the leadership team prefers a visual presentation with key data points featured. If so, focus your slides on data visualization and key takeaways, and consider creating a one-page infographic that highlights notable data.
Think about the organizational culture and how company leaders prefer to receive data. If your leadership team is interested in seeing detailed information with explanations, consider drafting a report that is similar to the State of the Industry. Perhaps the leadership team prefers a visual presentation with key data points featured. If so, focus your slides on data visualization and key takeaways, and consider creating a one-page infographic that highlights notable data.
Content
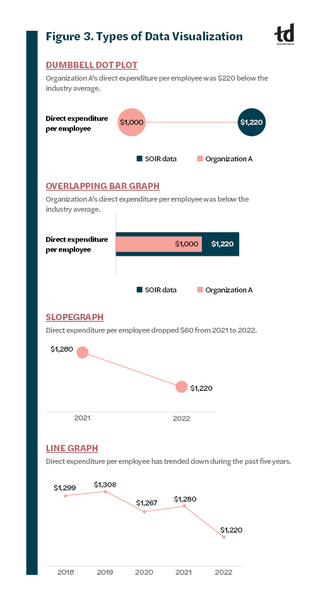
No matter what format you select, make sure to use the right data visualizations to illustrate the numbers (see Figure 3). For example, when comparing to a benchmark, consider using a dumbbell dot plot, which shows gaps between data. Another way to illustrate a comparison is an overlapping bar graph.
No matter what format you select, make sure to use the right data visualizations to illustrate the numbers (see Figure 3). For example, when comparing to a benchmark, consider using a dumbbell dot plot, which shows gaps between data. Another way to illustrate a comparison is an overlapping bar graph.
Content
If you have been collecting the data year over year, consider only showing your organizational data. If you have two years of data, a slopegraph may be the best type of visual. When you have multiple years of data, a line graph may be the best way to demonstrate that.
If you have been collecting the data year over year, consider only showing your organizational data. If you have two years of data, a slopegraph may be the best type of visual. When you have multiple years of data, a line graph may be the best way to demonstrate that.
Content
Whether you decide to write a report, create a PowerPoint presentation, or provide the data in some other format, tell the story of the data. You should be able to answer questions about why the data looks the way that it does, and come prepared to discuss how you can make improvements in the future.
Whether you decide to write a report, create a PowerPoint presentation, or provide the data in some other format, tell the story of the data. You should be able to answer questions about why the data looks the way that it does, and come prepared to discuss how you can make improvements in the future.
Content
After the presentation is over, you can begin thinking about next year. Each summer, ATD Research sends out the State of the Industry survey. Now that you know the process to gather the data in your own organization, you can start getting the information ready for the 2024 survey.
After the presentation is over, you can begin thinking about next year. Each summer, ATD Research sends out the State of the Industry survey. Now that you know the process to gather the data in your own organization, you can start getting the information ready for the 2024 survey.
Content
Download the 2023 State of the Industry report at td.org/SOIR.
Download the 2023 State of the Industry report at td.org/SOIR.
View Courses Recommended for You