TD Magazine Article
Member Benefit
Make Sense Out of Evaluation Data
Content
Converting raw data into credible insights doesn’t require sophisticated statistical knowledge or skills.
Converting raw data into credible insights doesn’t require sophisticated statistical knowledge or skills.
Wed Nov 01 2023

Content
Converting raw data into credible insights doesn't require sophisticated statistical knowledge or skills.
Converting raw data into credible insights doesn't require sophisticated statistical knowledge or skills.
Content
Collecting training program evaluation data is only one aspect of an L&D professional's job. To be a fully competent L&D professional, however, you must also know how to make sense of the data you collect. That means having the ability to convert raw data into actionable insights.
Collecting training program evaluation data is only one aspect of an L&D professional's job. To be a fully competent L&D professional, however, you must also know how to make sense of the data you collect. That means having the ability to convert raw data into actionable insights.
Content
The benefits are twofold: You will make learning program design decisions based on data, not intuition or opinion; and you will demonstrate learning program value using facts, not anecdotal information.
The benefits are twofold: You will make learning program design decisions based on data, not intuition or opinion; and you will demonstrate learning program value using facts, not anecdotal information.
The data on data
Content
Unfortunately, analyzing learning data is not an area that many L&D practitioners know much about or have experience doing. According to Towards Maturity's L&D's Relationship With Data and How to Use It More Effectively report, 51 percent of L&D professionals said their department can't use data effectively because they lack analytic skills. In addition, the Association for Talent Development's Effective Evaluation whitepaper reveals that only 40 percent of responding TD professionals believe their learning evaluation efforts helped them achieve their organization's business goals. Only 50 percent of respondents see those efforts as assistive in achieving the company's learning goals.
Unfortunately, analyzing learning data is not an area that many L&D practitioners know much about or have experience doing. According to Towards Maturity's L&D's Relationship With Data and How to Use It More Effectively report, 51 percent of L&D professionals said their department can't use data effectively because they lack analytic skills. In addition, the Association for Talent Development's Effective Evaluation whitepaper reveals that only 40 percent of responding TD professionals believe their learning evaluation efforts helped them achieve their organization's business goals. Only 50 percent of respondents see those efforts as assistive in achieving the company's learning goals.
Content
One reason for those troubling percentages is that most organizations only evaluate learning programs at Level 1 (reaction; 83 percent) and Level 2 (learning; 80 percent). Further, the ATD study found that only 54 percent conduct Level 3 (behavior) evaluations, 38 percent conduct Level 4 (results) evaluations, and 16 percent conduct Level 5 (return on investment) evaluations.
One reason for those troubling percentages is that most organizations only evaluate learning programs at Level 1 (reaction; 83 percent) and Level 2 (learning; 80 percent). Further, the ATD study found that only 54 percent conduct Level 3 (behavior) evaluations, 38 percent conduct Level 4 (results) evaluations, and 16 percent conduct Level 5 (return on investment) evaluations.
Content
A second reason is that few L&D professionals systematically analyze the evaluation data they collect to identify program trends, make program comparisons, or develop targeted corrective actions to improve program effectiveness—as evidenced by the fact that just half of TD professionals view their L&D department's efforts as helping the department achieve its learning goals.
A second reason is that few L&D professionals systematically analyze the evaluation data they collect to identify program trends, make program comparisons, or develop targeted corrective actions to improve program effectiveness—as evidenced by the fact that just half of TD professionals view their L&D department's efforts as helping the department achieve its learning goals.
Content
Measurement and evaluation experts such as Don and Jim Kirkpatrick, Jack and Patti Phillips, and Dave Vance, have frequently mentioned that the reasons for evaluating L&D initiatives are to demonstrate a training program's value, improve a training program, decide whether to continue or discontinue a training program, and run the learning department like a business. Yet, none of those are possible without first organizing evaluation data so that it offers insight into making informed learning program decisions.
Measurement and evaluation experts such as Don and Jim Kirkpatrick, Jack and Patti Phillips, and Dave Vance, have frequently mentioned that the reasons for evaluating L&D initiatives are to demonstrate a training program's value, improve a training program, decide whether to continue or discontinue a training program, and run the learning department like a business. Yet, none of those are possible without first organizing evaluation data so that it offers insight into making informed learning program decisions.
Guidelines to collecting data
Content
The data collected with Level 1–4 evaluations are of two types: quantitative and qualitative. Quantitative data is numeric and consists of Level 2 knowledge test scores, Level 1 and Level 3 Likert scale survey results, and Level 4 HR or business unit metrics such as turnover, lost time accidents, and sales. Qualitative data, on the other hand, is non-numeric and consists of written responses to open-ended or comment-box survey questions and participant responses recorded during a focus group or interview session.
The data collected with Level 1–4 evaluations are of two types: quantitative and qualitative. Quantitative data is numeric and consists of Level 2 knowledge test scores, Level 1 and Level 3 Likert scale survey results, and Level 4 HR or business unit metrics such as turnover, lost time accidents, and sales. Qualitative data, on the other hand, is non-numeric and consists of written responses to open-ended or comment-box survey questions and participant responses recorded during a focus group or interview session.
Content
When analyzing your collected evaluation data, keep in mind four general guidelines.
When analyzing your collected evaluation data, keep in mind four general guidelines.
Content
Include all relevant data. Don't discard some data points because they don't show the program you're evaluating in a positive light. The goal is to paint an accurate picture of what is and isn't working regarding a particular program so that you can take targeted, corrective actions to improve its effectiveness.
Include all relevant data. Don't discard some data points because they don't show the program you're evaluating in a positive light. The goal is to paint an accurate picture of what is and isn't working regarding a particular program so that you can take targeted, corrective actions to improve its effectiveness.
Content
Keep all evaluation data individually anonymous. You will get more authentic data if the respondents know their responses won't be linked to them. Emphasize the anonymity to learners before administering an evaluation. Another way to ensure personal anonymity is by making the training cohort group the unit of analysis rather than the individual participants.
Keep all evaluation data individually anonymous. You will get more authentic data if the respondents know their responses won't be linked to them. Emphasize the anonymity to learners before administering an evaluation. Another way to ensure personal anonymity is by making the training cohort group the unit of analysis rather than the individual participants.
Content
Use population samples where appropriate. If you're delivering a program to multiple cohorts, collecting data from all the attendees is unnecessary. Instead, select a random sample of participants—but ensure the selection process is random because, otherwise, you risk incorporating unintentional bias into the data.
Use population samples where appropriate. If you're delivering a program to multiple cohorts, collecting data from all the attendees is unnecessary. Instead, select a random sample of participants—but ensure the selection process is random because, otherwise, you risk incorporating unintentional bias into the data.
Content
Place participant demographic questions at the end of the evaluation. If you choose to collect such data, this best practice will help ensure you get honest responses to your evaluation items. Placing the questions at the beginning of the evaluation can cause some respondents to select more favorable responses out of concern that you may view their true responses as unfavorable. Make sure to also keep the number of demographic questions to a minimum and make completion optional (if appropriate).
Place participant demographic questions at the end of the evaluation. If you choose to collect such data, this best practice will help ensure you get honest responses to your evaluation items. Placing the questions at the beginning of the evaluation can cause some respondents to select more favorable responses out of concern that you may view their true responses as unfavorable. Make sure to also keep the number of demographic questions to a minimum and make completion optional (if appropriate).
Making sense of quantitative data
Content
Now that you know what statistics to use to decipher your collected evaluation data, let's look at how you would apply them to make sense of Level 1, 2, and 3 data (I won't cover Level 4 evaluations because they don't involve survey data or test scores).
Now that you know what statistics to use to decipher your collected evaluation data, let's look at how you would apply them to make sense of Level 1, 2, and 3 data (I won't cover Level 4 evaluations because they don't involve survey data or test scores).
Content
For Level 1 and Level 3 Likert scale survey data:
For Level 1 and Level 3 Likert scale survey data:
Content
Consolidate all like-minded survey items into scales.
Consolidate all like-minded survey items into scales.
Content
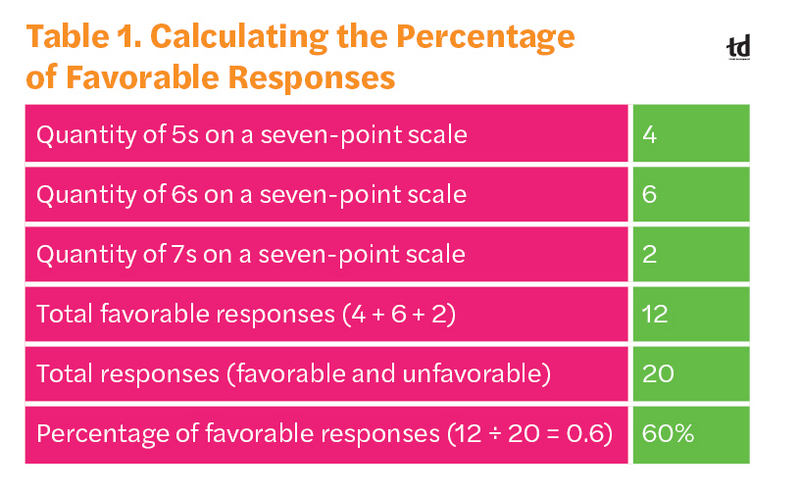
Compute the mean or the percentage of favorable responses for each item and scale.
Compute the mean or the percentage of favorable responses for each item and scale.
Content
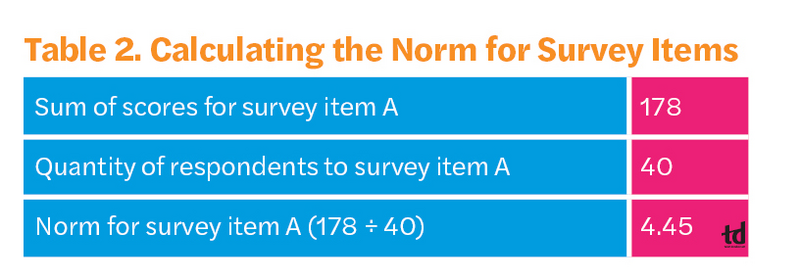
When using a mean score, include a comparison score such as a pretraining score, a norm, or a cut score.
When using a mean score, include a comparison score such as a pretraining score, a norm, or a cut score.
Content
Calculate the percentage of scores that exceed the comparison score.
Calculate the percentage of scores that exceed the comparison score.
Content
For Level 2 knowledge test score data:
For Level 2 knowledge test score data:
Content
Consolidate all like-minded test items into scales.
Consolidate all like-minded test items into scales.
Content
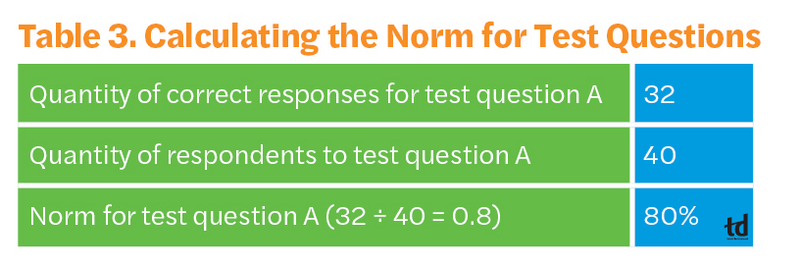
Compute the percentage of participants who answered each test question correctly; do the same for each scale.
Compute the percentage of participants who answered each test question correctly; do the same for each scale.
Content
Use a pre-program percentage, a norm, or a cut score as a comparison score.
Use a pre-program percentage, a norm, or a cut score as a comparison score.
Content
Calculate the percentage of correct responses that exceed the comparison score.
Calculate the percentage of correct responses that exceed the comparison score.
Making sense of qualitative data
Content
Comprehending the qualitative data you collect with your Level 1–3 evaluations is sometimes more challenging than deciphering the quantitative data. Note that providing a business executive with only a list of the comments received in response to a particular question is only half the work. The other half involves examining the comments so that they provide actionable insights. While there is no exact formula for doing so, you can use these steps:
Comprehending the qualitative data you collect with your Level 1–3 evaluations is sometimes more challenging than deciphering the quantitative data. Note that providing a business executive with only a list of the comments received in response to a particular question is only half the work. The other half involves examining the comments so that they provide actionable insights. While there is no exact formula for doing so, you can use these steps:
Content
Analyze the responses for themes or patterns.
Analyze the responses for themes or patterns.
Content
Consolidate all like-minded comments into clusters.
Consolidate all like-minded comments into clusters.
Content
Count the quantity of comments in each cluster.
Count the quantity of comments in each cluster.
Content
Place the clusters in numeric order from highest quantity to lowest.
Place the clusters in numeric order from highest quantity to lowest.
Content
Compare the results with the quantitative data collected and look for correlations.
Compare the results with the quantitative data collected and look for correlations.
Formulating conclusions and recommendations
Content
After summarizing the quantitative and qualitative data from the Level 1–3 evaluations, make conclusions and recommendations based on the results. Focus on scale scores first and compare each to a comparison score. Then you can highlight the scores above the comparison score and recommend ways to improve scores below the comparison score. As you examine the individual survey or test items that comprise each scale, note the high and low scores that account for the scale falling above or below the comparison score. Finally, recommend ways to improve item scores that fall significantly below the comparison score.
After summarizing the quantitative and qualitative data from the Level 1–3 evaluations, make conclusions and recommendations based on the results. Focus on scale scores first and compare each to a comparison score. Then you can highlight the scores above the comparison score and recommend ways to improve scores below the comparison score. As you examine the individual survey or test items that comprise each scale, note the high and low scores that account for the scale falling above or below the comparison score. Finally, recommend ways to improve item scores that fall significantly below the comparison score.
Content
There is no single best way to report the results from your evaluation efforts to a stakeholder. Nonetheless, a best practice is to start by determining the stakeholder's preferred method of communication. For example, some executives may want a report to review before meeting to discuss the results. Others may like to have a presentation that provides an overview of the results. Still others may want to meet and have an informal discussion.
There is no single best way to report the results from your evaluation efforts to a stakeholder. Nonetheless, a best practice is to start by determining the stakeholder's preferred method of communication. For example, some executives may want a report to review before meeting to discuss the results. Others may like to have a presentation that provides an overview of the results. Still others may want to meet and have an informal discussion.
Content
In any case, conveying the results using the stakeholder's preferred communication method will increase interest in your data and further position you as a valued business partner. You can additionally pique a stakeholder's interest by beginning with a hook (something interesting within the data) and delivering the data as a story. Take the stakeholder on a journey of discovery with a beginning, middle, and end. Make sure to tell the truth without bias and to provide context. Last, leave a final report.
In any case, conveying the results using the stakeholder's preferred communication method will increase interest in your data and further position you as a valued business partner. You can additionally pique a stakeholder's interest by beginning with a hook (something interesting within the data) and delivering the data as a story. Take the stakeholder on a journey of discovery with a beginning, middle, and end. Make sure to tell the truth without bias and to provide context. Last, leave a final report.
Content
Making sense of training evaluation data may seem like a daunting task. However, the math skills you learned in elementary school are all you need to produce credible, insightful results.
Making sense of training evaluation data may seem like a daunting task. However, the math skills you learned in elementary school are all you need to produce credible, insightful results.