TD Magazine Article
Member Benefit
Want to Speed Up Training Development Time?
Content
For better outcomes, analyze the L&D team’s data to gauge its operations and processes.
For better outcomes, analyze the L&D team’s data to gauge its operations and processes.
Wed Nov 01 2023

Content
For better outcomes, analyze the L&D team's data to gauge its operations and processes.
For better outcomes, analyze the L&D team's data to gauge its operations and processes.
Content
Alfred D. Chandler, a professor of business history, remarked that "Unless structure follows strategy, inefficiency results." His words could not be truer of the talent development industry.
Alfred D. Chandler, a professor of business history, remarked that "Unless structure follows strategy, inefficiency results." His words could not be truer of the talent development industry.
Content
For the past 20 years, the Association for Talent Development, in collaboration with researchers including myself, has researched and documented the topics of strategy, operations, and efficiency through the lens of how long it takes to develop training. The most recent data, collected earlier this year, also includes factors that influence training and development time and efficiency. However, TD professionals should use the results only as a starting point—collecting your own operational data specific to your organization will build a stronger case for validating your TD function's efforts and justifying resource needs.
For the past 20 years, the Association for Talent Development, in collaboration with researchers including myself, has researched and documented the topics of strategy, operations, and efficiency through the lens of how long it takes to develop training. The most recent data, collected earlier this year, also includes factors that influence training and development time and efficiency. However, TD professionals should use the results only as a starting point—collecting your own operational data specific to your organization will build a stronger case for validating your TD function's efforts and justifying resource needs.
Content
The data that ATD and I have gathered over the years is a true story of a repetitive industry woe. Regardless of how recent the data may be, the results are continuously sought-after information year after year based solely on consumption of all previous iterations of the research.
The data that ATD and I have gathered over the years is a true story of a repetitive industry woe. Regardless of how recent the data may be, the results are continuously sought-after information year after year based solely on consumption of all previous iterations of the research.
Content
While the 2023 research does indeed answer the question "How long does it take to develop training?," it also demonstrates the business value of TD functions collecting their own data.
While the 2023 research does indeed answer the question "How long does it take to develop training?," it also demonstrates the business value of TD functions collecting their own data.
Development time findings
Content
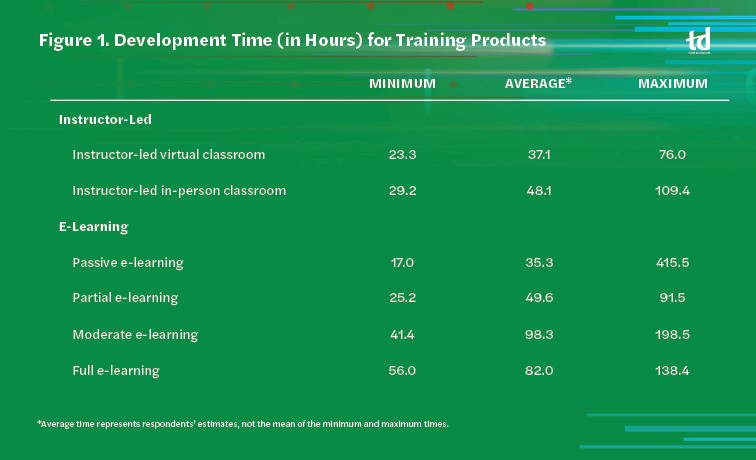
The study found that, on average, instructor-led training takes less time to produce than e-learning. Figure 1 shows the types of training products that respondents develop and the minimum, maximum, and average times it took to create each. The survey asked participants to calculate their time based on the work they perform for their current employer on the ADDIE model, excluding summative evaluation. The column of average hours is not a calculated average based on the minimum and maximum; rather, it is the average time respondents determined it takes them to create the selected training product.
The study found that, on average, instructor-led training takes less time to produce than e-learning. Figure 1 shows the types of training products that respondents develop and the minimum, maximum, and average times it took to create each. The survey asked participants to calculate their time based on the work they perform for their current employer on the ADDIE model, excluding summative evaluation. The column of average hours is not a calculated average based on the minimum and maximum; rather, it is the average time respondents determined it takes them to create the selected training product.
Content
Within e-learning, more engaging initiatives (such as simulations and game-based play) require more time whereas having more passive-based training (that is to say, "page turners") decreases development time. In looking at the maximum time to develop e-learning, there is variance in development hours that contradicts the previous statement. However, we need to consider each respondent's perspective. Some individuals, for example, may be creating a large curriculum. Additionally, a respondent's skill level will also affect development time, not to mention familiarity with the content they are creating.
Within e-learning, more engaging initiatives (such as simulations and game-based play) require more time whereas having more passive-based training (that is to say, "page turners") decreases development time. In looking at the maximum time to develop e-learning, there is variance in development hours that contradicts the previous statement. However, we need to consider each respondent's perspective. Some individuals, for example, may be creating a large curriculum. Additionally, a respondent's skill level will also affect development time, not to mention familiarity with the content they are creating.
Content
For instance, an instructional designer with professional credentialing in their first job role will likely take more time than an individual who has worked in the field for several years. Nonetheless, both can experience an increase in development hours if they are new to a company as they learn the organization's content, processes, and learning assets.
For instance, an instructional designer with professional credentialing in their first job role will likely take more time than an individual who has worked in the field for several years. Nonetheless, both can experience an increase in development hours if they are new to a company as they learn the organization's content, processes, and learning assets.
Content
Seat time, or the average module (or unit or session) length, was also part of the requested data, as was a set of questions on microlearning. However, variance in how participants interpreted those questions' instructions created issues that compromised the findings. Likewise, questions on augmented and virtual reality as well as artificial intelligence did not yield enough responses to make inferences on them.
Seat time, or the average module (or unit or session) length, was also part of the requested data, as was a set of questions on microlearning. However, variance in how participants interpreted those questions' instructions created issues that compromised the findings. Likewise, questions on augmented and virtual reality as well as artificial intelligence did not yield enough responses to make inferences on them.
Content
The largest conclusion we can draw comfortably from the data is that development time still varies considerably for each type of learning product—and no matter what, the variables of the training development for each organization greatly differ. We do not advise that you use the results as stand-alone pieces for calculating project estimates because context is necessary to understand respondents' situations.
The largest conclusion we can draw comfortably from the data is that development time still varies considerably for each type of learning product—and no matter what, the variables of the training development for each organization greatly differ. We do not advise that you use the results as stand-alone pieces for calculating project estimates because context is necessary to understand respondents' situations.
What interferes with developing training efficiently?
Content
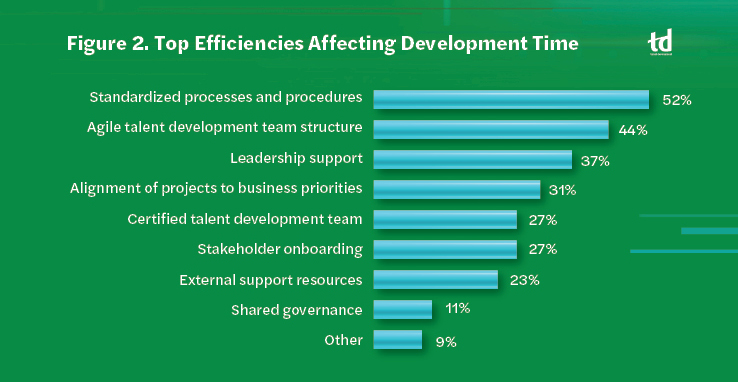
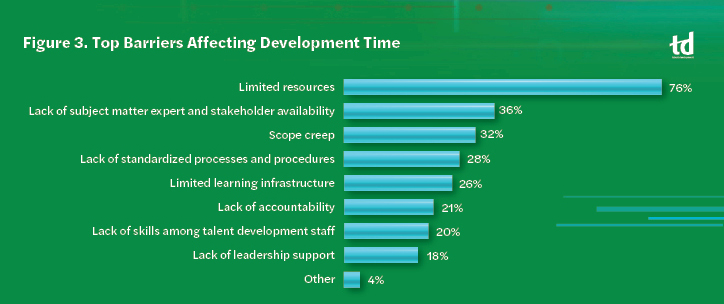
From the introduction of the survey two decades ago until now, the development time has generated many explanations and rationales for why the data is accurate or totally off. Therefore, we started asking respondents about the factors that affect development time from two perspectives: the barriers to being faster and the efficiencies.
From the introduction of the survey two decades ago until now, the development time has generated many explanations and rationales for why the data is accurate or totally off. Therefore, we started asking respondents about the factors that affect development time from two perspectives: the barriers to being faster and the efficiencies.
Content
The top three perceived efficiencies to developing training are having standardized processes and procedures, an agile TD team structure, and support of leadership (see Figure 2). The top three barriers to development are limited resources, lack of SME and stakeholder availability, and scope creep (see Figure 3).
The top three perceived efficiencies to developing training are having standardized processes and procedures, an agile TD team structure, and support of leadership (see Figure 2). The top three barriers to development are limited resources, lack of SME and stakeholder availability, and scope creep (see Figure 3).
Content
To understand more about how the different barriers and efficiencies influence the time to develop training, we built a statistical model that examines the influence of having each barrier as a top barrier or each efficiency as a top efficiency and can estimate about 19 percent of the variance in time to develop using only those factors. For example, having no leadership support implies that the time to develop will be less.
To understand more about how the different barriers and efficiencies influence the time to develop training, we built a statistical model that examines the influence of having each barrier as a top barrier or each efficiency as a top efficiency and can estimate about 19 percent of the variance in time to develop using only those factors. For example, having no leadership support implies that the time to develop will be less.
Content
Three of the model's findings deserve particular attention in the context of real-world cases: the results of standardizing processes, working with limited resources, and gaining support from leadership. Those are repetitive issues that have existed as long as this research and relate to efficient development time, whether their impact is positive or negative.
Three of the model's findings deserve particular attention in the context of real-world cases: the results of standardizing processes, working with limited resources, and gaining support from leadership. Those are repetitive issues that have existed as long as this research and relate to efficient development time, whether their impact is positive or negative.
Content
As you review the following case studies, keep in mind that this survey asked only for the top three barriers and efficiencies. That does not mean that those factors are the sole ones affecting development time.
As you review the following case studies, keep in mind that this survey asked only for the top three barriers and efficiencies. That does not mean that those factors are the sole ones affecting development time.
Content
Is efficiency what most training developers strive for in totality? No; they want to be more efficient in developing a learning product of quality that aids in changing training participants' knowledge base or performance. Remember this point: Do not conflate efficiency with effectiveness.
Is efficiency what most training developers strive for in totality? No; they want to be more efficient in developing a learning product of quality that aids in changing training participants' knowledge base or performance. Remember this point: Do not conflate efficiency with effectiveness.
Standardization
Content
Based on the model, it takes organizations that consider standardized templates and processes among their top efficiencies longer, on average, to develop training than organizations that do not. Although that does not mean having standardized processes and templates slows down a TD professional, it does indicate that having standardized processes and templates at the forefront of becoming efficient may have compounding factors.
Based on the model, it takes organizations that consider standardized templates and processes among their top efficiencies longer, on average, to develop training than organizations that do not. Although that does not mean having standardized processes and templates slows down a TD professional, it does indicate that having standardized processes and templates at the forefront of becoming efficient may have compounding factors.
Content
That is what Bethany Shean, vice president of education services for Home Builders Institute, gleaned from the capacity analysis she conducted in her department. By specifically assessing the one-year-old instructional design team, she knew the analysis would reveal opportunities for process improvement and stabilization of the team's formation.
That is what Bethany Shean, vice president of education services for Home Builders Institute, gleaned from the capacity analysis she conducted in her department. By specifically assessing the one-year-old instructional design team, she knew the analysis would reveal opportunities for process improvement and stabilization of the team's formation.
Content
As part of the capacity analysis, each education services team member tracked their work to defined categories (for example, design, development, documentation, and quality assurance) that represented the department's common work. The tracking provided many insights, two of which became prominent: the need for all team members to use a common language to define activities outlined in the processes and procedures as well as the need for each member to perform work that aligns more closely with their job role.
As part of the capacity analysis, each education services team member tracked their work to defined categories (for example, design, development, documentation, and quality assurance) that represented the department's common work. The tracking provided many insights, two of which became prominent: the need for all team members to use a common language to define activities outlined in the processes and procedures as well as the need for each member to perform work that aligns more closely with their job role.
Content
That information is in light of the team growing quickly through several internal promotions and hiring replacements while implementing several high-priority initiatives. Those factors made it difficult to completely onboard new team members while allowing the promoted individuals to fully adopt their new roles. Those issues not only created more nuanced problems for the team, but also affected the use of vendors.
That information is in light of the team growing quickly through several internal promotions and hiring replacements while implementing several high-priority initiatives. Those factors made it difficult to completely onboard new team members while allowing the promoted individuals to fully adopt their new roles. Those issues not only created more nuanced problems for the team, but also affected the use of vendors.
Content
"As in our case, the lack of standard processes and language in general has had a direct impact on the efficiency/progress of the work that our vendors do," Shean explains. "Whether you're onboarding vendors, partners, employees, other internal departmental stakeholders, etc., a lack of standard processes increases the likelihood for bottlenecks. The data gleaned from the vendors in the capacity analysis supports this notion. Adding a ‘green' \[novice\] team perspective compounds this challenge."
"As in our case, the lack of standard processes and language in general has had a direct impact on the efficiency/progress of the work that our vendors do," Shean explains. "Whether you're onboarding vendors, partners, employees, other internal departmental stakeholders, etc., a lack of standard processes increases the likelihood for bottlenecks. The data gleaned from the vendors in the capacity analysis supports this notion. Adding a ‘green' \[novice\] team perspective compounds this challenge."
Content
Shean's case brings up questions such as:
Shean's case brings up questions such as:
Content
Does my team need to resolve these inefficiencies first?
Does my team need to resolve these inefficiencies first?
Content
How often does each team member follow the process as is versus modifying it for how they prefer to work?
How often does each team member follow the process as is versus modifying it for how they prefer to work?
Content
Does my department use terms equally and comprehend how those terms influence its work?
Does my department use terms equally and comprehend how those terms influence its work?
Content
Such questions can help to reduce the reactiveness to work and project requests as well as inconsistencies when applying processes and procedures. In turn, it should aid in more efficient development of training.
Such questions can help to reduce the reactiveness to work and project requests as well as inconsistencies when applying processes and procedures. In turn, it should aid in more efficient development of training.
Limited resources
Content
The training and development specialist for Pharmacy Data Management, Allana Bowman, represents more than half (56 percent) of the survey participants in that she is a department of one. As such, she covers all aspects of the training development process—the true definition of a limited resource.
The training and development specialist for Pharmacy Data Management, Allana Bowman, represents more than half (56 percent) of the survey participants in that she is a department of one. As such, she covers all aspects of the training development process—the true definition of a limited resource.
Content
Our model infers that having limited resources as a barrier is a surefire way to see development time go up. However, that doesn't stop stakeholders from requesting more things in less time. To that point, TD professionals like Bowman must navigate their organizations' demands, and data provides the ability to substantiate the need for more time and resources.
Our model infers that having limited resources as a barrier is a surefire way to see development time go up. However, that doesn't stop stakeholders from requesting more things in less time. To that point, TD professionals like Bowman must navigate their organizations' demands, and data provides the ability to substantiate the need for more time and resources.
Content
By keeping her own data on how long projects and job-related tasks take her to perform, Bowman plays a more consultative role with stakeholders and uses data to help them better consider their requests. For example, if a stakeholder presents an urgent project, Bowman first confirms whether they are the only stakeholder. She then pulls together all stakeholders and positions the need against the current docket of work and the trade-offs of putting that project first. Bowman doesn't outright say no, but she collaborates with stakeholders to discuss what is best for the business.
By keeping her own data on how long projects and job-related tasks take her to perform, Bowman plays a more consultative role with stakeholders and uses data to help them better consider their requests. For example, if a stakeholder presents an urgent project, Bowman first confirms whether they are the only stakeholder. She then pulls together all stakeholders and positions the need against the current docket of work and the trade-offs of putting that project first. Bowman doesn't outright say no, but she collaborates with stakeholders to discuss what is best for the business.
Content
Bowman is also navigating uncharted territory because she is the first to fill her role at the company. Therefore, data is even more critical in helping her to educate stakeholders and in developing standard frameworks for different types of training development needs.
Bowman is also navigating uncharted territory because she is the first to fill her role at the company. Therefore, data is even more critical in helping her to educate stakeholders and in developing standard frameworks for different types of training development needs.
Content
However, sometimes Bowman uses data to simply ask targeted questions to determine a solution and timeline. Time is not necessarily on her side, given that she focuses on one to two training development initiatives per month on top of overseeing rolling projects, managing technological infrastructure, being a coach, and facilitating strategic conversations at the organizational level.
However, sometimes Bowman uses data to simply ask targeted questions to determine a solution and timeline. Time is not necessarily on her side, given that she focuses on one to two training development initiatives per month on top of overseeing rolling projects, managing technological infrastructure, being a coach, and facilitating strategic conversations at the organizational level.
Content
If the stakeholders' demands become the priority, Bowman would not be able to prioritize the responsibilities her role demands. That means time to develop training would definitively take longer.
If the stakeholders' demands become the priority, Bowman would not be able to prioritize the responsibilities her role demands. That means time to develop training would definitively take longer.
Leadership support
Content
Why would having minimal leadership support be associated with less development time? Our model's findings could not provide a reason, but we have made some confident assumptions: Lacking leadership support could result in cutting corners when developing training—for example, not performing quality control measures nor using standards or templates.
Why would having minimal leadership support be associated with less development time? Our model's findings could not provide a reason, but we have made some confident assumptions: Lacking leadership support could result in cutting corners when developing training—for example, not performing quality control measures nor using standards or templates.
Content
So, what happens when the L&D function gains adequate leadership support? A return on net value of millions of dollars, in one case. Juan Naranjo, senior manager of design and development for a large, North American media company, discovered that return on net value via his leadership-backed data-collection initiative.
So, what happens when the L&D function gains adequate leadership support? A return on net value of millions of dollars, in one case. Juan Naranjo, senior manager of design and development for a large, North American media company, discovered that return on net value via his leadership-backed data-collection initiative.
Content
What's compelling about his case is that Naranjo wasn't looking for the data; the company just happened to assign work to internal teams that it commonly gives to training and development vendors to create.
What's compelling about his case is that Naranjo wasn't looking for the data; the company just happened to assign work to internal teams that it commonly gives to training and development vendors to create.
Content
During data analysis, Naranjo's assumption was that work would have a higher associated cost because there would be a learning curve for the internal training developers to accomplish the task. However, he was pleasantly surprised to learn that wasn't the truth. The atypical project work incentivized internal training developers to upskill and create the solutions that usually took the specialized talents of vendors, such as the internal development of a virtual reality asset that cost a quarter of the price that external vendors quoted.
During data analysis, Naranjo's assumption was that work would have a higher associated cost because there would be a learning curve for the internal training developers to accomplish the task. However, he was pleasantly surprised to learn that wasn't the truth. The atypical project work incentivized internal training developers to upskill and create the solutions that usually took the specialized talents of vendors, such as the internal development of a virtual reality asset that cost a quarter of the price that external vendors quoted.
Content
That discovery led Naranjo to propose a different vendor strategy approach for training and development for a greater return on value to the organization. The company now only uses vendors for three different use situations: The internal training development team is at capacity, it is exploring a technology for the first time, or the assets are for generic skills (such as emotional intelligence or Agile principles, for which the company can purchase off-the-shelf solutions).
That discovery led Naranjo to propose a different vendor strategy approach for training and development for a greater return on value to the organization. The company now only uses vendors for three different use situations: The internal training development team is at capacity, it is exploring a technology for the first time, or the assets are for generic skills (such as emotional intelligence or Agile principles, for which the company can purchase off-the-shelf solutions).
Content
Another benefit to keeping vendors in the mix is that it creates a competitive training development team eager to cultivate skills and develop solutions that the company would otherwise outsource.
Another benefit to keeping vendors in the mix is that it creates a competitive training development team eager to cultivate skills and develop solutions that the company would otherwise outsource.
Value of operational data
Content
Each of the three case studies demonstrates not only key findings from the survey results, but also a variety of survey respondents based on job role and organization size. The examples outline value propositions for the use of data that include tracking development time. Although Shean, Bowman, and Naranjo took different approaches to their data collection and had different motivations, a pattern emerged:
Each of the three case studies demonstrates not only key findings from the survey results, but also a variety of survey respondents based on job role and organization size. The examples outline value propositions for the use of data that include tracking development time. Although Shean, Bowman, and Naranjo took different approaches to their data collection and had different motivations, a pattern emerged:
Content
Each discussed their efforts from the lens of training and development as a business function for their organization.
Each discussed their efforts from the lens of training and development as a business function for their organization.
Content
Each viewed data with regard to return on value for their organization rather than return on investment.
Each viewed data with regard to return on value for their organization rather than return on investment.
Content
Each sought a specific answer but also discovered additional trends within their data. The discoveries yielded unexpected benefits that they used to inform their operational infrastructure and processes related to training and development.
Each sought a specific answer but also discovered additional trends within their data. The discoveries yielded unexpected benefits that they used to inform their operational infrastructure and processes related to training and development.
Content
Each discussed the criticality of stakeholder relationships and the use of data to build common understanding toward the operations of training and development.
Each discussed the criticality of stakeholder relationships and the use of data to build common understanding toward the operations of training and development.
Content
With the updated development numbers in front of you, along with compelling examples demonstrating the value of operational data, my only question left is: How long will it take for you to begin collecting data?
With the updated development numbers in front of you, along with compelling examples demonstrating the value of operational data, my only question left is: How long will it take for you to begin collecting data?
About the Research
Content
The target population for this survey was training and development professionals covering organizations of various sizes and industries. The survey resulted in 115 high-quality, usable responses. Forty-six percent of respondents worked for small organizations (499 or fewer employees), 41 percent came from midsize entities (500 to 9,999 employees), and the remaining 13 percent came from large organizations (10,000 or more employees).
The target population for this survey was training and development professionals covering organizations of various sizes and industries. The survey resulted in 115 high-quality, usable responses. Forty-six percent of respondents worked for small organizations (499 or fewer employees), 41 percent came from midsize entities (500 to 9,999 employees), and the remaining 13 percent came from large organizations (10,000 or more employees).