Talent Development Leader
Maximize the Value of Learning Analytics
Content
Consider these four questions when launching or assessing your analytics engine.
Consider these four questions when launching or assessing your analytics engine.
Mon Jun 17 2024

Content
During the past 15 to 20 years, learning feedback processes and data collection have become more varied and sophisticated. An array of affordable technology tools enable L&D functions to synthesize large datasets and extract meaning to help L&D leaders manage the business of learning. With the rapid ascent of generative artificial intelligence, learning analytics can rise to a new level.
During the past 15 to 20 years, learning feedback processes and data collection have become more varied and sophisticated. An array of affordable technology tools enable L&D functions to synthesize large datasets and extract meaning to help L&D leaders manage the business of learning. With the rapid ascent of generative artificial intelligence, learning analytics can rise to a new level.
Content
L&D functions not only can synthesize data more efficiently and effectively but also generate insights in real time to guide learners in their personal and professional development journeys.
L&D functions not only can synthesize data more efficiently and effectively but also generate insights in real time to guide learners in their personal and professional development journeys.
Content
When organizations effectively harness learning analytics, it can make the difference between a mediocre L&D function and a best-in-class organization that improves both L&D and the broader business. Value isn’t a given, however, (even with generative AI) and requires thoughtful effort to get the maximum benefits.
When organizations effectively harness learning analytics, it can make the difference between a mediocre L&D function and a best-in-class organization that improves both L&D and the broader business. Value isn’t a given, however, (even with generative AI) and requires thoughtful effort to get the maximum benefits.
Content
In Measurement Demystified, David Vance and I define learning analytics as “the science and art of gathering, processing, and interpreting data. It may include advanced statistical techniques (such as regression) to extract insights from data or discover relationships among measures. The goal of learning analytics is to provide insights that inform decisions and the management of the learning function.”
In Measurement Demystified, David Vance and I define learning analytics as “the science and art of gathering, processing, and interpreting data. It may include advanced statistical techniques (such as regression) to extract insights from data or discover relationships among measures. The goal of learning analytics is to provide insights that inform decisions and the management of the learning function.”
Content
So, how can you get the most out of your analytics efforts? How can you ensure you have a continuous feedback loop between what you measure, what you analyze, and what you report? How can you derive meaning from the data? Below are four key questions to consider as you launch or assess your analytics engine.
So, how can you get the most out of your analytics efforts? How can you ensure you have a continuous feedback loop between what you measure, what you analyze, and what you report? How can you derive meaning from the data? Below are four key questions to consider as you launch or assess your analytics engine.
What are your goals and priorities?
Content
Whether you have an existing analytics function or are creating one, ask yourself: “What do we want to achieve with analytics?”
Whether you have an existing analytics function or are creating one, ask yourself: “What do we want to achieve with analytics?”
Content
Too many L&D functions view analytics as a process that generates vast quantities of data in the form of static reports or interactive dashboards. Without a clear purpose of what you hope to achieve, you will inevitably invest in the wrong places and then wonder why L&D and business leaders continue to hunger for more.
Too many L&D functions view analytics as a process that generates vast quantities of data in the form of static reports or interactive dashboards. Without a clear purpose of what you hope to achieve, you will inevitably invest in the wrong places and then wonder why L&D and business leaders continue to hunger for more.
Content
Start by asking what problems you need to solve. You may need to address multiple issues, so articulate all of them.
Start by asking what problems you need to solve. You may need to address multiple issues, so articulate all of them.
Content
Do you intend to use analytics to improve how L&D leaders manage the function? That is, will your analytics supply insights about leading indicators of performance, such as the impact of learning on growing pivotal skills?
Do you intend to use analytics to improve how L&D leaders manage the function? That is, will your analytics supply insights about leading indicators of performance, such as the impact of learning on growing pivotal skills?
Content
Will analytics enable L&D to improve the effectiveness, efficiency, and business impact of their programs? For example, are your high-cost programs delivering a sufficient return to justify the spend? Is your sales development program improving sales growth?
Will analytics enable L&D to improve the effectiveness, efficiency, and business impact of their programs? For example, are your high-cost programs delivering a sufficient return to justify the spend? Is your sales development program improving sales growth?
Content
Will the data help accelerate learners’ skills growth by tailoring development recommendations to each learner based on their skill and career direction? Are learners consuming the right content and the right amount of content? When testing learner knowledge, which concepts are problematic for a specific learner and what should they do about it?
Will the data help accelerate learners’ skills growth by tailoring development recommendations to each learner based on their skill and career direction? Are learners consuming the right content and the right amount of content? When testing learner knowledge, which concepts are problematic for a specific learner and what should they do about it?
What audiences do you serve and what are their needs?
Content
Learning analytics should benefit the L&D function, HR, and business leaders. Each of those stakeholder groups has different needs, wants, and expectations for what analytics can provide.
Learning analytics should benefit the L&D function, HR, and business leaders. Each of those stakeholder groups has different needs, wants, and expectations for what analytics can provide.
Content
For L&D leaders, analytics should enable operational excellence. The data should answer the question: “Are learning programs efficient (in other words, providing the right learning at the right time in the right form for the right audience) and effective (in other words, provide high-quality content and instruction that result in high levels of application on the job)?”
For L&D leaders, analytics should enable operational excellence. The data should answer the question: “Are learning programs efficient (in other words, providing the right learning at the right time in the right form for the right audience) and effective (in other words, provide high-quality content and instruction that result in high levels of application on the job)?”
Content
For HR, analytics should demonstrate that learning programs are improving skills in the right areas and at the right pace. Analytics should also identify which formal and informal development affect employee retention.
For HR, analytics should demonstrate that learning programs are improving skills in the right areas and at the right pace. Analytics should also identify which formal and informal development affect employee retention.
Content
For both L&D and the business, analytics should demonstrate the impact of strategic programs on performance (individual and team) and the organization.
For both L&D and the business, analytics should demonstrate the impact of strategic programs on performance (individual and team) and the organization.
What is the right cadence for culling insights?
Content
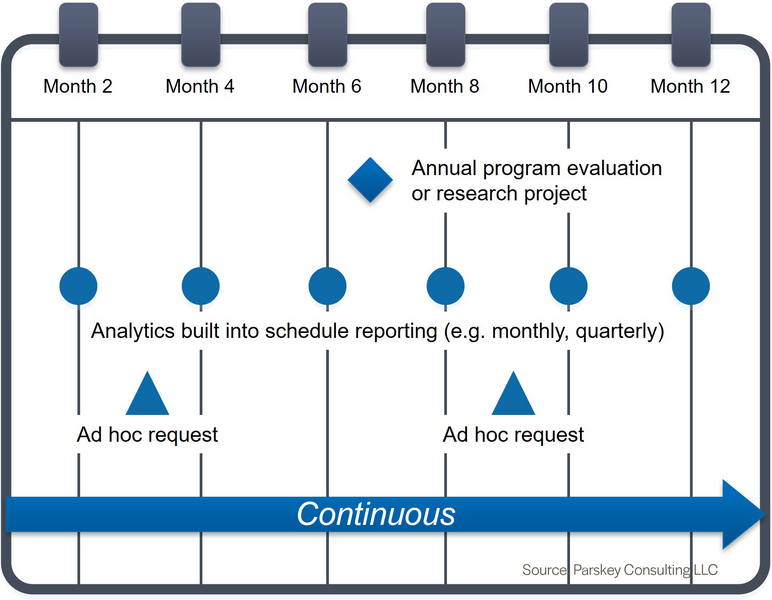
Now that you have a clear purpose and understand your audience’s needs, you should consider the cadence of extracting insights. If L&D leaders make curriculum and program decisions monthly, but the reporting process supplies analytic insights quarterly, the data will lag the decision-making cycle and be of limited use. Alternatively, if the reporting process delivers a continuous stream of data for decisions made annually, the sheer volume and frequency of the data will overwhelm L&D stakeholders with noise and significantly diminish the power of the data.
Now that you have a clear purpose and understand your audience’s needs, you should consider the cadence of extracting insights. If L&D leaders make curriculum and program decisions monthly, but the reporting process supplies analytic insights quarterly, the data will lag the decision-making cycle and be of limited use. Alternatively, if the reporting process delivers a continuous stream of data for decisions made annually, the sheer volume and frequency of the data will overwhelm L&D stakeholders with noise and significantly diminish the power of the data.
Content
There are four common cadences to consider.
There are four common cadences to consider.
Content
Annual analytics projects. These entail a robust program evaluation or a research project that provides evidence about the efficiency, effectiveness, and impact of strategic, visible, or costly programs (for example, leadership development or sales training) or demonstrate a causal link between a core process and expected outcomes (such as the link between training and career mobility). Findings from those projects can inform policies, practices, and processes for the business and drive a culture of continuous improvement.
Annual analytics projects. These entail a robust program evaluation or a research project that provides evidence about the efficiency, effectiveness, and impact of strategic, visible, or costly programs (for example, leadership development or sales training) or demonstrate a causal link between a core process and expected outcomes (such as the link between training and career mobility). Findings from those projects can inform policies, practices, and processes for the business and drive a culture of continuous improvement.
Content
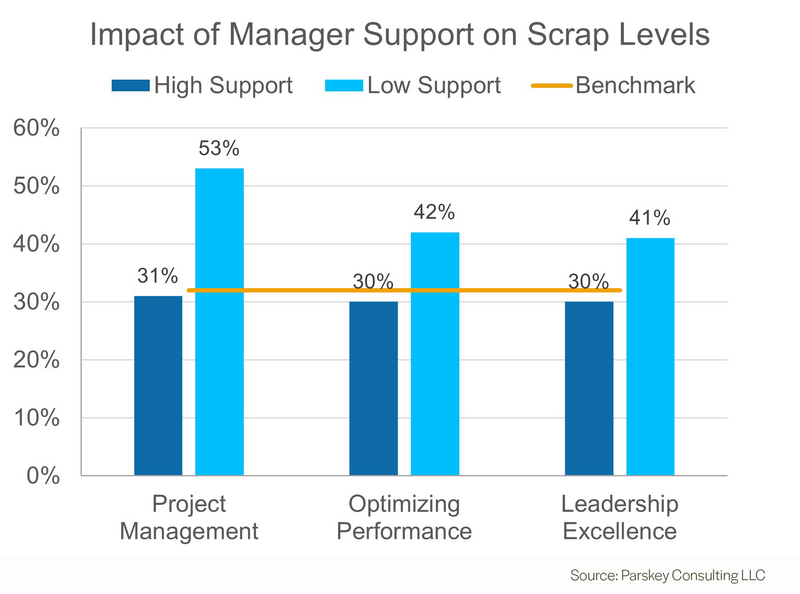
Periodic reporting. This method integrates analytics into the graphs and displays. For example, Explorance's The Predictive Learning Impact Model 2.0 whitepaper has uncovered that “managers substantially and positively influence expected application, meaning they play a critical role in making training more effective.”
Periodic reporting. This method integrates analytics into the graphs and displays. For example, Explorance's The Predictive Learning Impact Model 2.0 whitepaper has uncovered that “managers substantially and positively influence expected application, meaning they play a critical role in making training more effective.”
Content
With that in mind, to quantify the impact of support on application levels, reports could show the level of application from employees with high management support versus those with low management support. Business leaders can then follow up to enhance development discussions particularly for students with low management support.
With that in mind, to quantify the impact of support on application levels, reports could show the level of application from employees with high management support versus those with low management support. Business leaders can then follow up to enhance development discussions particularly for students with low management support.
Content
Ad hoc requests. Successful analytics functions leave space for ad hoc requests from stakeholders, which provide insights into new measures that L&D should track or provide guidance on how to visualize and display information in existing reports.
Ad hoc requests. Successful analytics functions leave space for ad hoc requests from stakeholders, which provide insights into new measures that L&D should track or provide guidance on how to visualize and display information in existing reports.
Content
Continuous flow of insights. This area of analytics has surfaced as a prime opportunity for investment with the availability of generative AI. By combining learner profiles with consumption and feedback data, organizations can tailor learner recommendations about the types of learning available, the sequence, and the timing. The added benefit of delivering insights directly to learners is that it reinforces the importance of providing feedback on training received as a critical input to the analytics insights.
Continuous flow of insights. This area of analytics has surfaced as a prime opportunity for investment with the availability of generative AI. By combining learner profiles with consumption and feedback data, organizations can tailor learner recommendations about the types of learning available, the sequence, and the timing. The added benefit of delivering insights directly to learners is that it reinforces the importance of providing feedback on training received as a critical input to the analytics insights.
How will you ensure stakeholders glean insights from the data?
Content
Your job is not complete when you deliver reports, dashboards, or slide decks to stakeholders. It’s your responsibility to ensure that they consume them and can derive meaningful insights from what you provide.
Your job is not complete when you deliver reports, dashboards, or slide decks to stakeholders. It’s your responsibility to ensure that they consume them and can derive meaningful insights from what you provide.
Content
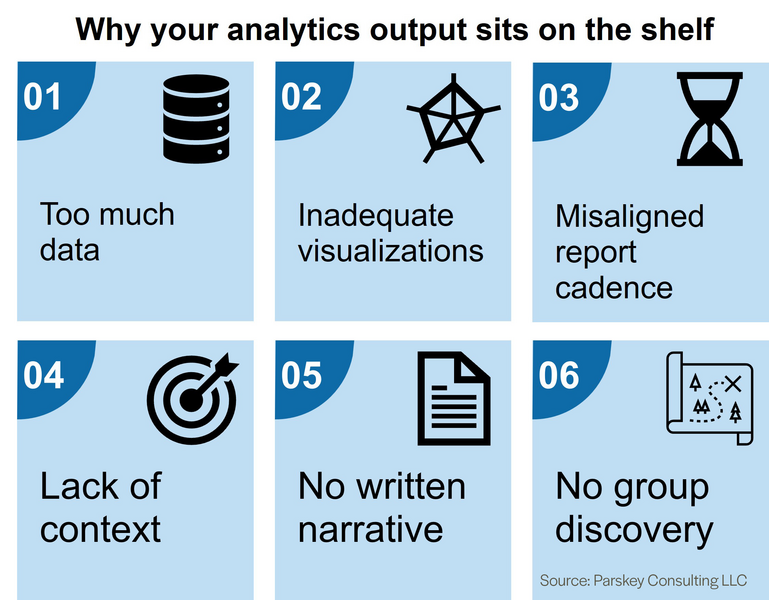
There is a high probability that your audiences don’t read the reports, access the dashboard, or know how to interpret the data, despite the quality or robustness of your analytics. Six common reasons contribute to shelf sitting, so tackle them before you begin.
There is a high probability that your audiences don’t read the reports, access the dashboard, or know how to interpret the data, despite the quality or robustness of your analytics. Six common reasons contribute to shelf sitting, so tackle them before you begin.
Content
Too much data. You conduct a robust analysis and want to share it all. Don’t. Cut it down to the executive summary and the most critical elements your audience needs to know.
Too much data. You conduct a robust analysis and want to share it all. Don’t. Cut it down to the executive summary and the most critical elements your audience needs to know.
Content
Inadequate visualizations. There are dozens of books on the topic to explore. Your visualizations should make it easy for the viewer to interpret the chart or graph quickly.
Inadequate visualizations. There are dozens of books on the topic to explore. Your visualizations should make it easy for the viewer to interpret the chart or graph quickly.
Content
Misaligned report cadence. As discussed earlier, reporting must align with the cadence of decisions in the organization. Consider when leaders make decisions and align your reporting with that cadence.
Misaligned report cadence. As discussed earlier, reporting must align with the cadence of decisions in the organization. Consider when leaders make decisions and align your reporting with that cadence.
Content
Lack of context. A stakeholder sees a declining or increasing trend. At what point should they be concerned? Add a goal, benchmark, or threshold to provide guidance on how to interpret the results.
Lack of context. A stakeholder sees a declining or increasing trend. At what point should they be concerned? Add a goal, benchmark, or threshold to provide guidance on how to interpret the results.
Content
No written narrative. Don’t assume that the charts or graphs are self-explanatory. Add a sentence or a hover-over box that explains what caused a dip in the Net Promoter Score in November or why an instructor’s scored spiked in the third quarter.
No written narrative. Don’t assume that the charts or graphs are self-explanatory. Add a sentence or a hover-over box that explains what caused a dip in the Net Promoter Score in November or why an instructor’s scored spiked in the third quarter.
Content
No group discovery. It’s the rare individual who can look at a report and extract all the insights from the data. However, if you put individuals together in a room to review and discuss what they see, they can uncover the story through their collective questions and insights. Consider scheduling data parties to engage your stakeholders in discussions about their insights and what actions they can take to improve the results.
No group discovery. It’s the rare individual who can look at a report and extract all the insights from the data. However, if you put individuals together in a room to review and discuss what they see, they can uncover the story through their collective questions and insights. Consider scheduling data parties to engage your stakeholders in discussions about their insights and what actions they can take to improve the results.
From data to insights
Content
The evolution of learning feedback processes and data collection sophistication has paved the way for significant change within the L&D function. With access to affordable technology and generative AI, L&D teams can now synthesize data and generate meaningful, timely insights for a broad spectrum of stakeholders.
The evolution of learning feedback processes and data collection sophistication has paved the way for significant change within the L&D function. With access to affordable technology and generative AI, L&D teams can now synthesize data and generate meaningful, timely insights for a broad spectrum of stakeholders.
Content
However, leveraging those advancements requires a strategic approach that aligns analytics efforts with organizational goals, meets the diverse needs of stakeholders, and ensures insights lead to actionable change. By considering analytics objectives, understanding audience needs, optimizing insight cadence, and fostering engagement with the data, L&D leaders can maximize the impact of learning analytics.
However, leveraging those advancements requires a strategic approach that aligns analytics efforts with organizational goals, meets the diverse needs of stakeholders, and ensures insights lead to actionable change. By considering analytics objectives, understanding audience needs, optimizing insight cadence, and fostering engagement with the data, L&D leaders can maximize the impact of learning analytics.
Content
The transition from data to insights to tangible impact involves thoughtful planning, diligent execution, and ongoing refinement. When you execute it effectively, learning analytics goes beyond being a measurement tool to becoming a powerful catalyst for growth and innovation in L&D and the whole organization.
The transition from data to insights to tangible impact involves thoughtful planning, diligent execution, and ongoing refinement. When you execute it effectively, learning analytics goes beyond being a measurement tool to becoming a powerful catalyst for growth and innovation in L&D and the whole organization.
Content
Read more from Talent Development Leader .
Read more from Talent Development Leader.